Science, Technology & Society
Featured schools near , edit
Types of Degrees Science, Technology & Society Majors Are Earning
People majoring in Science, Technology & Society have the option of earning degrees at several award levels.
| Award Level | Graduates |
|---|---|
| Associate’s Degree | 4 |
| Bachelor’s Degree | 625 |
| Master’s Degree | 123 |
| Doctor’s Degree | 36 |
What Science, Technology & Society Majors Need to Know
Programs in Science, Technology & Society develop a specific mix of knowledge, skills, and abilities — derived from O*NET surveys of workers in occupations that Science, Technology & Society graduates commonly enter.
Knowledge Areas
According to O*NET, a major in Science, Technology & Society emphasizes the following knowledge areas:
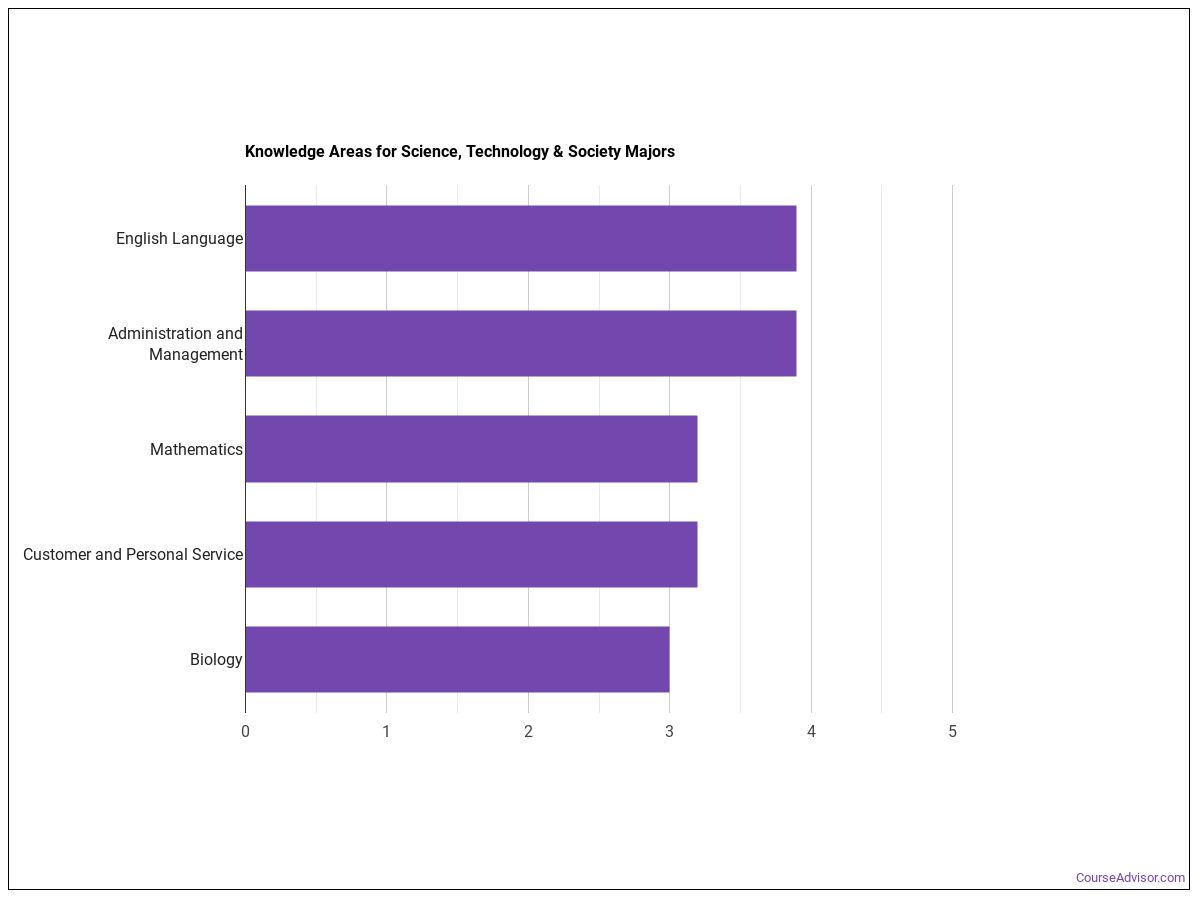
- Customer and Personal Service — Importance 3.9 / 5; level 4.6 / 7.
- English Language — Importance 3.8 / 5; level 4.2 / 7.
- Administrative — Importance 3.5 / 5; level 4.3 / 7.
- Biology — Importance 3.2 / 5; level 3.7 / 7.
- Administration and Management — Importance 3.1 / 5; level 3.3 / 7.
Importance is rated 1–5; level is 1–7. Source: ONET Online — weighted across related occupations.*
Skills
Skills built by a Science, Technology & Society program reflects the day-to-day work of related occupations:
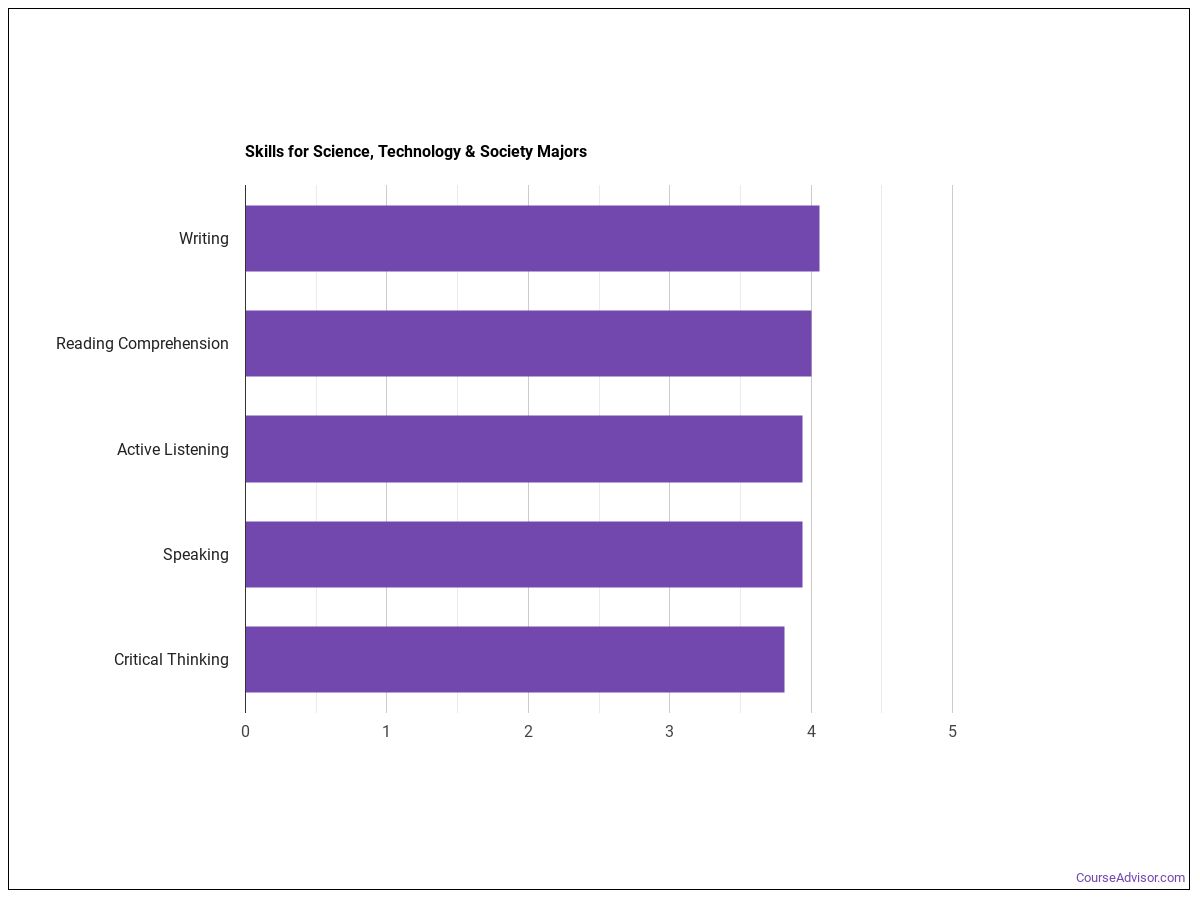
- Active Listening — Importance 4 / 5; level 4.2 / 7.
- Reading Comprehension — Importance 4 / 5; level 4.4 / 7.
- Writing — Importance 4.0 / 5; level 4.2 / 7.
- Speaking — Importance 3.9 / 5; level 4.1 / 7.
- Critical Thinking — Importance 3.8 / 5; level 4.1 / 7.
Abilities
Innate abilities most relevant to Science, Technology & Society careers — again drawn from O*NET surveys of related occupations:
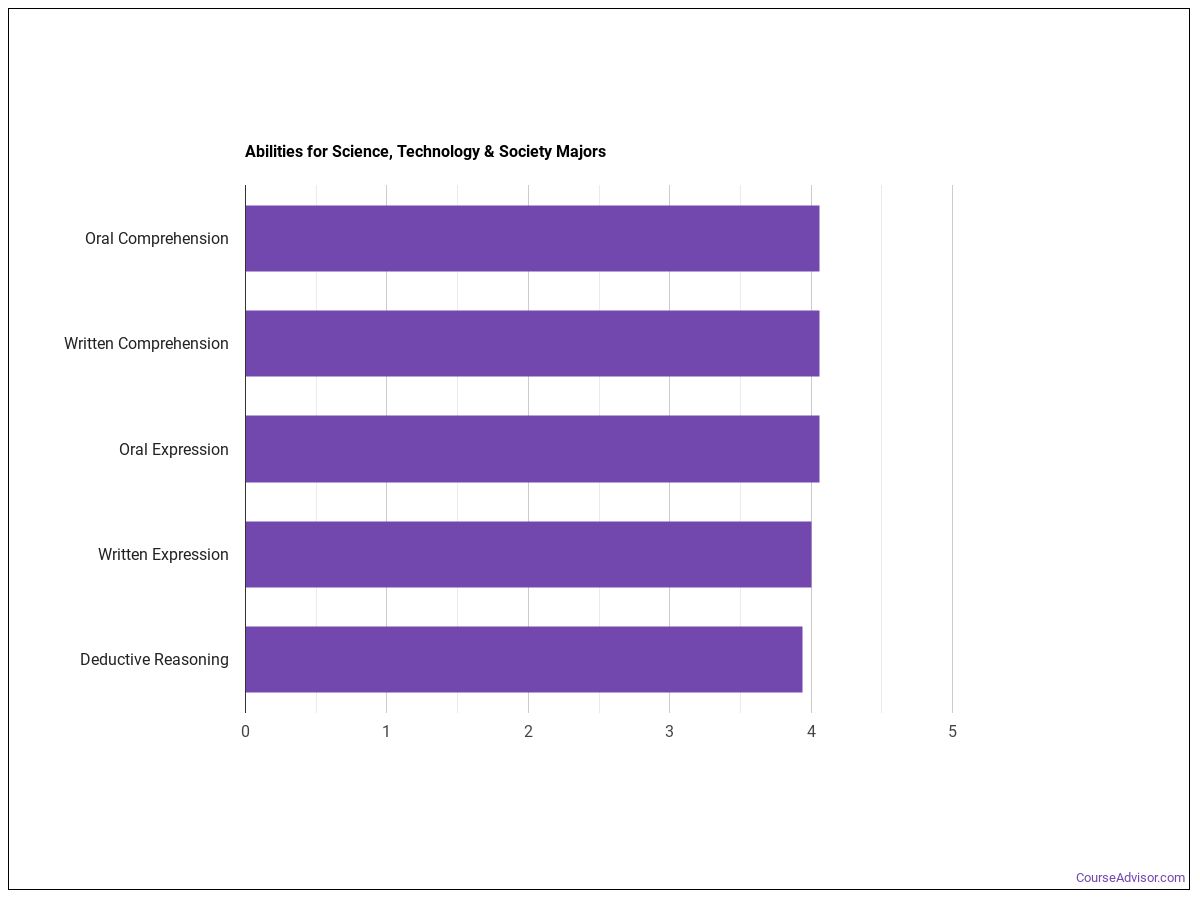
- Written Comprehension — Importance 4.0 / 5; level 4.4 / 7.
- Oral Expression — Importance 4 / 5; level 4.4 / 7.
- Oral Comprehension — Importance 4 / 5; level 4.5 / 7.
- Written Expression — Importance 4.0 / 5; level 4.2 / 7.
- Deductive Reasoning — Importance 4.0 / 5; level 4.2 / 7.
Common Job Activities
Day-to-day, Science, Technology & Society graduates report doing:
| Activity | Frequency / Importance |
|---|---|
| Getting Information | 4.4 / 7 |
| Documenting/Recording Information | 4.4 / 7 |
| Organizing, Planning, and Prioritizing Work | 4.4 / 7 |
| Working with Computers | 4.4 / 7 |
| Communicating with Supervisors, Peers, or Subordinates | 4.2 / 7 |
| Monitoring Processes, Materials, or Surroundings | 4.2 / 7 |
| Evaluating Information to Determine Compliance with Standards | 4.1 / 7 |
| Scheduling Work and Activities | 4.0 / 7 |
| Establishing and Maintaining Interpersonal Relationships | 4.0 / 7 |
| Making Decisions and Solving Problems | 4.0 / 7 |
Technology Skills Used on the Job
Most frequently-cited tools used by Science, Technology & Society professionals:
| Tool / Software | Category | In-Demand |
|---|---|---|
| Microsoft Office software | Office suite software | ✓ |
| Web browser software | Internet browser software | — |
| Microsoft Outlook | Electronic mail software | — |
| Microsoft Word | Word processing software | ✓ |
| Microsoft PowerPoint | Presentation software | ✓ |
| Microsoft Excel | Spreadsheet software | ✓ |
| R | Object or component oriented development software | ✓ |
| StataCorp Stata | Analytical or scientific software | — |
| SAS | Analytical or scientific software | — |
| IBM SPSS Statistics | Analytical or scientific software | — |
| Microsoft Project | Project management software | — |
| The MathWorks MATLAB | Analytical or scientific software | — |
Source: ONET Online technology skills, weighted across related occupations.*
Sample Job Titles
Real job postings for Science, Technology & Society graduates include:
- University Teacher
- Lecturer
- Labor Relations Teacher
- Flight Teacher
- Associate Professor
- Naval Science Teacher
- Industrial Arts Teacher
- Teacher
- Packaging Professor
- Braille Teacher
- Interior Design Teacher
- City Planning Teacher
- Faculty Member
- Urban Planning Teacher
- Project Management Professor
Education Typically Required
Across the occupations open to Science, Technology & Society graduates, the typical level of education actually held by current workers is distributed as:
| Education Level | Share of Workers |
|---|---|
| Bachelor’s degree | 53.4% |
| Master’s degree | 12.0% |
| Postsecondary certificate | 7.7% |
| Some college courses | 6.2% |
| Post-doctoral training | 6.0% |
| Associate’s degree (or other 2-year) | 5.6% |
| High school diploma or equivalent | 4.7% |
| Doctoral degree | 3.9% |
| Post-baccalaureate certificate | 0.5% |

Source: ONET Online education / training / experience requirements.*
Who Is Earning a Degree in Science, Technology & Society?
Gender Distribution
This field has a relatively balanced gender distribution: 56.2% women and 43.8% men among Science, Technology & Society graduates.
| Gender | Graduates | Share |
|---|---|---|
| Women | 443 | 56.2% |
| Men | 345 | 43.8% |
Racial-Ethnic Diversity
At the national level, the racial-ethnic distribution of Science, Technology & Society graduates is as follows:
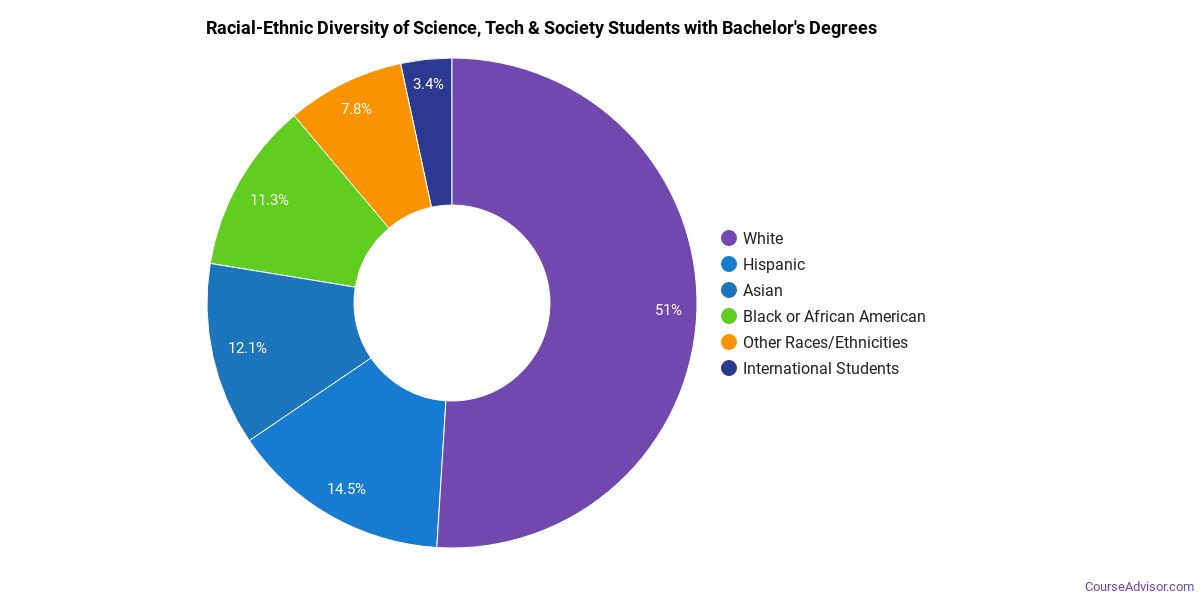
| Race / Ethnicity | Graduates | Share |
|---|---|---|
| White | 375 | 47.6% |
| Asian | 96 | 12.2% |
| Hispanic or Latino | 118 | 15.0% |
| Black or African American | 93 | 11.8% |
| American Indian / Alaska Native | 4 | 0.5% |
| Two or More Races | 35 | 4.4% |
| Race Unknown | 15 | 1.9% |
| International Students | 52 | 6.6% |
See minority definition below.
How Much Do Science, Technology & Society Graduates Earn?
The U.S. Department of Education tracks median earnings of Science, Technology & Society graduates 1, 4, and 5 years after completion. Wages typically rise steadily as graduates gain experience and move into mid-career roles.
| Years Out | Median Earnings |
|---|---|
| 1 year | $47,991 |
| 4 years | $72,006 |
| 5 years | $81,090 |
By year 5 out, median earnings rise to $81,090 — roughly 69% above the 1-year mark.
Source: U.S. Department of Education College Scorecard, field-of-study earnings tracker.
Online Science, Technology & Society Programs
Distance learning is reported by IPEDS for Science, Technology & Society. The table below shows how many graduates earned at least some of their coursework online (Distance-Ed Available) versus completing the entire program online (Distance-Ed Only).
| Award Level | Distance-Ed Available | Distance-Ed Only |
|---|---|---|
| Bachelor’s | 2 | 0 |
| Master’s | 3 | 0 |
Distance-Ed Only = degrees completed entirely online; Distance-Ed Available = degrees including at least some online coursework. Source: IPEDS Completions by Distance Education status.
Is a Degree in Science, Technology & Society Worth It?
On the earnings side, the federal earnings tracker, Science, Technology & Society graduates earn a median of $72,006 four years after completion — roughly 89% above the national median for workers with only a high school diploma (~$38,000).
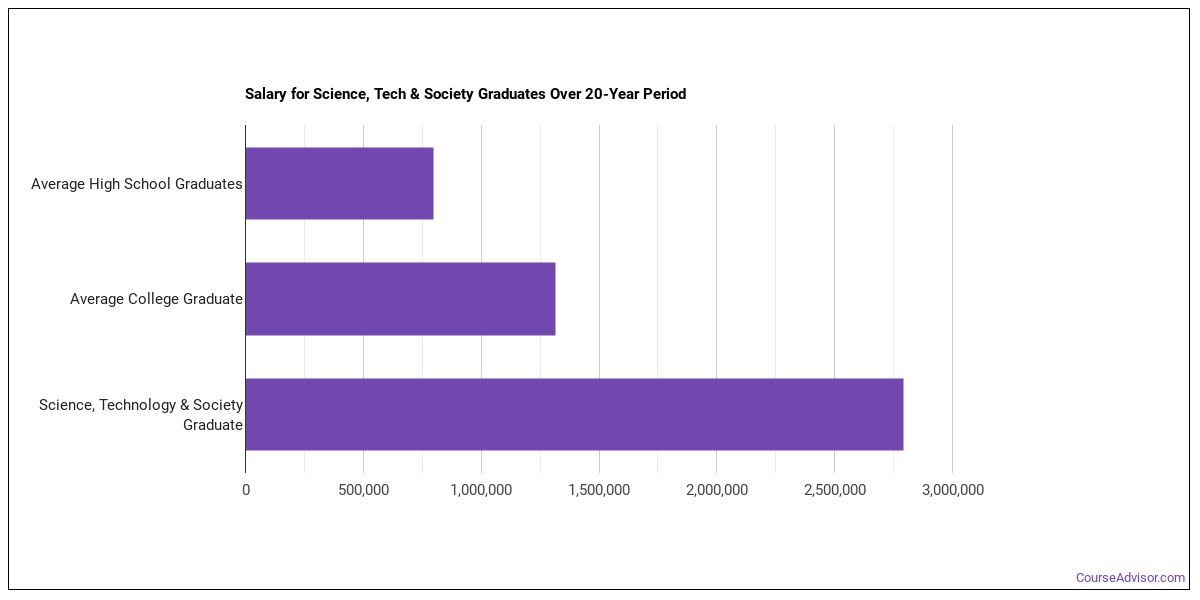
ROI estimate compares the program’s 4-yr median earnings against the 2023 BLS CPS median earnings for high-school-only workers. Source: U.S. Department of Education College Scorecard + BLS Current Population Survey.
Related Programs
You may also be interested in these closely related fields of study:
| Program | CIP Code |
|---|---|
| Multi Interdisciplinary Studies | 30 |
| Accounting and Computer Science | 30.16 |
| Anthrozoology | 30.34 |
| Behavioral Sciences | 30.17 |
| Biological and Physical Sciences | 30.01 |
| Biopsychology | 30.10 |
| Classical and Ancient Studies | 30.22 |
| Climate Science | 30.35 |
| Cognitive Science | 30.25 |
| Computational Science | 30.30 |
| Cultural Studies and Comparative Literature | 30.36 |
| Cultural Studies/Critical Theory and Analysis | 30.26 |
Explore Science, Technology & Society by State
Alabama
California
District of Columbia
Idaho
Kansas
Maryland
Mississippi
Nevada
New York
Oklahoma
South Carolina
Utah
West Virginia
Alaska
Colorado
Florida
Illinois
Kentucky
Massachusetts
Missouri
New Hampshire
North Carolina
Oregon
South Dakota
Vermont
Wisconsin
References
The racial-ethnic minorities count is calculated by taking the total number of students and subtracting white students and international students. This number is then divided by the total number of students to obtain the racial-ethnic minorities percentage.
- College Factual
- National Center for Education Statistics (IPEDS)
- O*NET Online
- U.S. Bureau of Labor Statistics
- U.S. Department of Education College Scorecard
More about our data sources and methodologies.
Course Advisor provides higher-education, college and university, degree, program, career, salary, and other helpful information to students, faculty, institutions, and other internet audiences. Presented information and data are subject to change. Inclusion on this website does not imply or represent a direct relationship with the company, school, or brand. Information, though believed correct at time of publication, may not be correct, and no warranty is provided. Contact the schools to verify any information before relying on it. Financial aid may be available for those who qualify. The displayed options may include sponsored or recommended results, not necessarily based on your preferences.
© Course Advisor – All Rights Reserved.