Managers, All Other in Pennsylvania
Want to work as a Managers, All Other in Pennsylvania? Here’s what you need to know. All managers not listed separately.
What do Managers, All Other Make in Pennsylvania?
For a managers, all other working in Pennsylvania, wages run about $129,170 per year (or roughly $62.10/hour).Annual wages span from $74,030 at the 10th percentile to $210,050 at the 90th percentile.
| Wage Statistic | Annual | Hourly |
|---|---|---|
| 10th percentile | $74,030 | $35.59 |
| 25th percentile | $97,910 | $47.07 |
| Median (50th) | $129,170 | $62.10 |
| 75th percentile | $165,650 | $79.64 |
| 90th percentile | $210,050 | $100.99 |

Location quotient — how concentrated this career is in Pennsylvania compared to the national average — is 0.99.
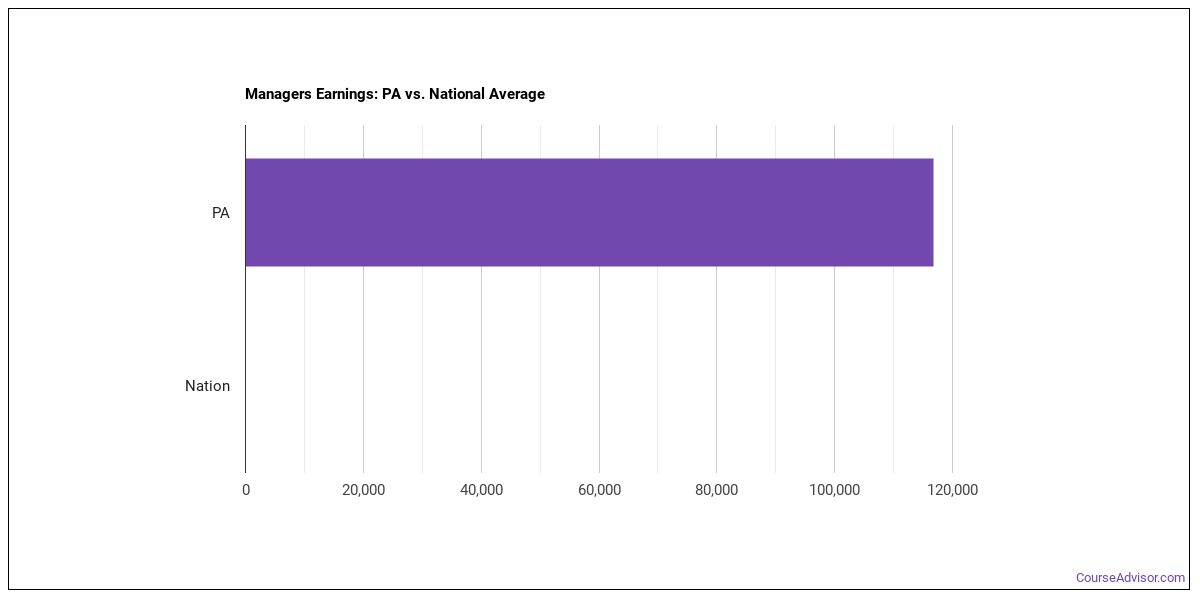
National Wage Comparison
Nationally, managers, all other earn a median of $95,684 per year ($46.00/hour), higher than the Pennsylvania median.
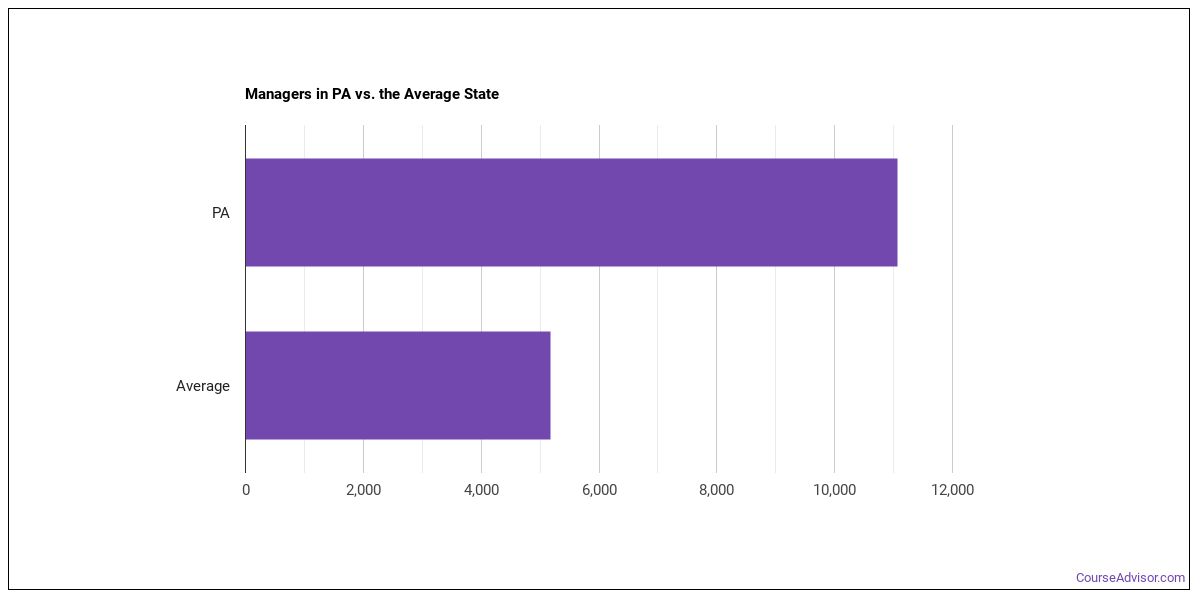
Employment Outlook
Nationally, total employment in this occupation is 440,588 managers, all other nationwide. In Pennsylvania alone, around 24,480 people work in this role. That’s higher than the typical state, which employs around 5,640 managers, all other.

Top Pennsylvania Metros for Managers, All Other
These are the Pennsylvania metros with the most managers, all other in Pennsylvania.
| Metro Area | Number Employed | Annual Median Salary |
|---|---|---|
| Philadelphia-Camden-Wilmington, PA-NJ-DE-MD | 13,830 | $138,940 |
| Pittsburgh, PA | 4,570 | $125,570 |
| Harrisburg-Carlisle, PA | 1,670 | $122,600 |
| Allentown-Bethlehem-Easton, PA-NJ | 1,100 | $125,570 |
| York-Hanover, PA | 590 | $129,750 |
| Scranton–Wilkes-Barre, PA | 570 | $108,730 |
| Lancaster, PA | 550 | $107,100 |
| Reading, PA | 450 | $121,540 |
| Erie, PA | 220 | $101,280 |
| State College, PA | 200 | $108,490 |
| Altoona, PA | 140 | $102,220 |
| Chambersburg, PA | 130 | $118,320 |
| Lebanon, PA | 120 | $105,610 |
| Williamsport, PA | 120 | $103,460 |
| Johnstown, PA | 110 | $102,030 |
| Gettysburg, PA | 80 | $131,590 |
Top States for Managers, All Other Employment
The table below shows the states where the most managers, all other work.
| State | Number Employed |
|---|---|
| California | 103,510 |
| Texas | 53,070 |
| Florida | 46,500 |
| Georgia | 36,520 |
| Pennsylvania | 24,480 |
| New Jersey | 24,000 |
| Virginia | 22,210 |
| North Carolina | 21,150 |
| Maryland | 20,810 |
| District of Columbia | 18,180 |
| Tennessee | 17,260 |
| New York | 16,640 |
| Louisiana | 15,360 |
| Wisconsin | 13,910 |
| Colorado | 13,710 |
| Nevada | 10,990 |
| Washington | 10,740 |
| Massachusetts | 10,670 |
| Ohio | 9,390 |
| Arizona | 9,280 |
Highest-Paying States for Managers, All Other
Where managers, all other earn the most: managers, all other.
| State | Annual Median Salary |
|---|---|
| Massachusetts | $172,380 |
| District of Columbia | $171,910 |
| California | $170,740 |
| Delaware | $170,310 |
| Washington | $165,080 |
| Colorado | $164,010 |
| New Jersey | $163,630 |
| Virginia | $162,610 |
| New York | $161,360 |
| Minnesota | $158,680 |
What Major Will Prepare You For This Career?
Related college programs include:
- Business Administration & Management
- Business & Commerce
- Entrepreneurial Studies
- Hospitality Management
- Telecommunications Management
- General Psychology
- Clinical & Counseling Psychology
- Child Development & Psychology
- Other Psychology
- Economics
- Political Science & Government
- Sociology
- General Social Sciences
- International Relations & Security
- Anthropology
- Criminology
- Geography & Cartography
- Other Social Sciences
- Urban Studies
- Sociology & Anthropology
- Archeology
- Demography & Population Studies
- Geography and Anthropology
- Criminal Justice & Corrections
- Homeland Security
- Fire Protection
- Security Science and Technology
- History
- Public Administration
- Radio, TV & Digital Communication
- Library & Information Science
- Information Technology
- Arts & Media Management
- Systems Theory
- History and Language/Literature
- Philosophy, Politics, and Economics
- Digital Humanities and Textual Studies
- Economics and Computer Science
- History and Political Science
- Historic Preservation
- Geoarcheaology
- Linguistics and Anthropology
- Economics and Foreign Language/Literature
- Pharmacy/Pharmaceutical Sciences
- Health/Medical Admin Services
- Natural Resource Management
- Religious Institution Administration and Law
Featured schools near , edit
Also Known As
Animal Ride Manager, Aquatic Facility Manager, Area Development Manager, Area Supervisor, Armored Transport Service Manager, Art Coordinator, Arts Administrator, Association Executive, Auto Repair Shop Manager, Barber or Beauty Shop Manager, Billiard Parlor Manager, Billing Manager, Board of Education Secretary, Body Shop Manager, Bowling Alley Manager.
References
- U.S. Bureau of Labor Statistics, Occupational Employment and Wage Statistics — https://www.bls.gov/oes/
- O*NET Online — https://www.onetonline.org/
- BLS Employment Projections — https://www.bls.gov/emp/
- O*NET-SOC code: 11-9199.00
Course Advisor provides higher-education, college and university, degree, program, career, salary, and other helpful information to students, faculty, institutions, and other internet audiences. Presented information and data are subject to change. Inclusion on this website does not imply or represent a direct relationship with the company, school, or brand. Information, though believed correct at time of publication, may not be correct, and no warranty is provided. Contact the schools to verify any information before relying on it. Financial aid may be available for those who qualify. The displayed options may include sponsored or recommended results, not necessarily based on your preferences.
© Course Advisor – All Rights Reserved.