Social Scientists and Related Workers, All Other in Washington
Considering working as a Social Scientists and Related Workers, All Other in Washington? Here’s what the data says. All social scientists and related workers not listed separately.
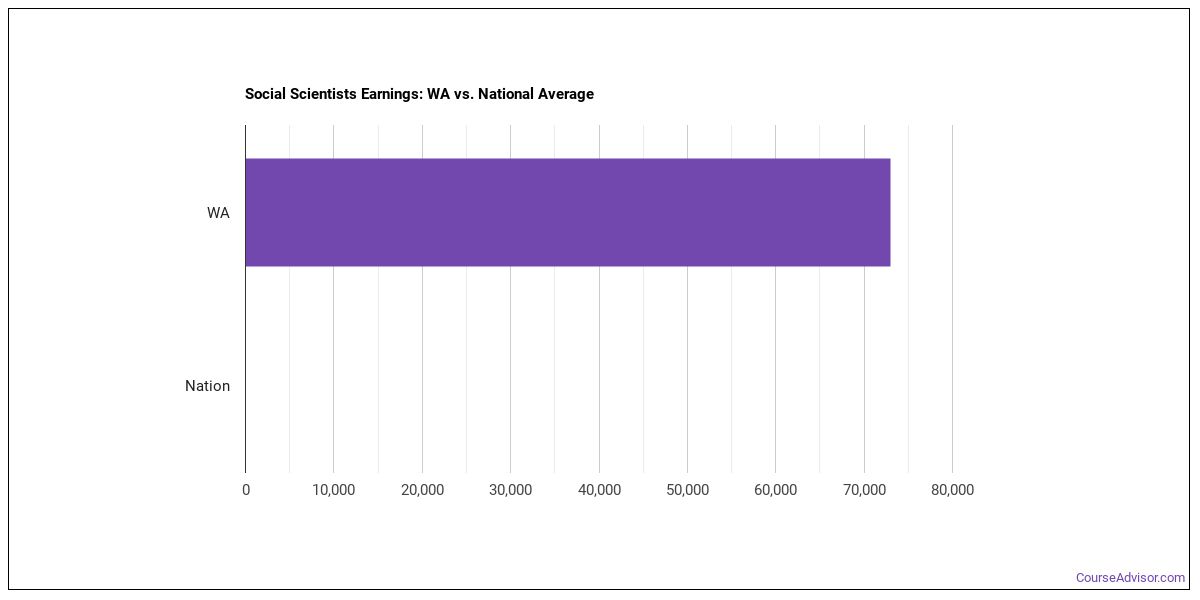
What do Social Scientists and Related Workers, All Other Make in Washington?
For a social scientists and related workers, all other working in Washington, wages run about $107,100 per year (or about $51.49/hour).Annual wages span from $71,610 at the 10th percentile to $179,250 at the 90th percentile.
| Wage Statistic | Annual | Hourly |
|---|---|---|
| 10th percentile | $71,610 | $34.43 |
| 25th percentile | $87,280 | $41.96 |
| Median (50th) | $107,100 | $51.49 |
| 75th percentile | $141,090 | $67.83 |
| 90th percentile | $179,250 | $86.18 |

Location quotient — how concentrated this career is in Washington relative to the national average — is 1.26, indicating that social scientists and related workers, all other are more concentrated here than the national average.
National Wage Comparison
Nationally, social scientists and related workers, all other earn a median of $42,168 per year ($20.27/hour), higher than the Washington median.
Employment Outlook
There are roughly 23,164 social scientists and related workers, all other in the U.S.. In Washington alone, around 1,070 people work in this role. That’s more than the typical state, which employs around 320 social scientists and related workers, all other.


Top Washington Metros for Social Scientists and Related Workers, All Other
The metro areas below employ the most social scientists and related workers, all other in Washington.
| Metro Area | Number Employed | Annual Median Salary |
|---|---|---|
| Seattle-Tacoma-Bellevue, WA | 670 | $105,800 |
| Kennewick-Richland, WA | 60 | $178,810 |
| Olympia-Lacey-Tumwater, WA | 60 | $113,590 |
Top States for Social Scientists and Related Workers, All Other Employment
These states have the highest employment of social scientists and related workers, all other work.
| State | Number Employed |
|---|---|
| Virginia | 4,390 |
| New York | 3,090 |
| District of Columbia | 2,700 |
| California | 2,650 |
| Maryland | 2,520 |
| Texas | 2,480 |
| North Carolina | 1,660 |
| Ohio | 1,560 |
| Florida | 1,560 |
| Georgia | 1,330 |
| Washington | 1,070 |
| Minnesota | 910 |
| Colorado | 790 |
| Pennsylvania | 750 |
| Michigan | 720 |
| Arizona | 700 |
| Illinois | 650 |
| Massachusetts | 430 |
| Louisiana | 410 |
| Kentucky | 370 |
Highest-Paying States for Social Scientists and Related Workers, All Other
These states pay the most for social scientists and related workers, all other.
| State | Annual Median Salary |
|---|---|
| Virginia | $144,320 |
| Maryland | $129,750 |
| District of Columbia | $122,320 |
| Washington | $107,100 |
| Massachusetts | $104,770 |
| New York | $102,570 |
| Connecticut | $102,150 |
| Hawaii | $102,000 |
| California | $101,110 |
| Colorado | $101,000 |
What Major Will Prepare You For This Career?
Several college majors map to this occupation:
- General Social Sciences
- Other Social Sciences
- Demography & Population Studies
- Behavioral Science
- Sustainability Science
- Human Biology
- Geography and Environmental Studies
- Peace Studies & Conflict Resolution
- Gerontology
- Multicultural & Diversity Studies
- Cultural Studies & Analysis
- Biopsychology
- Philosophy, Politics, and Economics
- History and Political Science
- Anthrozoology
- Holocaust Studies
- Geoarcheaology
- Linguistics and Anthropology
- Economics and Foreign Language/Literature
- Educational Assessment
- Public Policy
- Bioethics/Medical Ethics
- Child Development & Family Studies
- Linguistics & Literature
- Natural Resource Management
Featured schools near , edit
Also Known As
Behavioral Scientist, Computational Linguist, Demographer, Developmental Psychologist, Director of Research, Ethnologist, Etymologist, Experimental Psychologist, Forensic Psychologist, Group Tester, Health Psychologist, Human Factors Scientist, Intelligence Research Specialist, Intelligence Specialist, Jury Consultant.
References
- U.S. Bureau of Labor Statistics, Occupational Employment and Wage Statistics — https://www.bls.gov/oes/
- O*NET Online — https://www.onetonline.org/
- BLS Employment Projections — https://www.bls.gov/emp/
- O*NET-SOC code: 19-3099.00
Course Advisor provides higher-education, college and university, degree, program, career, salary, and other helpful information to students, faculty, institutions, and other internet audiences. Presented information and data are subject to change. Inclusion on this website does not imply or represent a direct relationship with the company, school, or brand. Information, though believed correct at time of publication, may not be correct, and no warranty is provided. Contact the schools to verify any information before relying on it. Financial aid may be available for those who qualify. The displayed options may include sponsored or recommended results, not necessarily based on your preferences.
© Course Advisor – All Rights Reserved.