Drama & Theater Arts at University of Maryland-College Park
What traits are you looking for in a school for Drama & Theater Arts, consider the program at University of Maryland-College Park. We’ve gathered the following information to help you decide.
University of Maryland-College Park sits in College Park, MD.
In the most recent year for which we have data, 34 drama & theater arts degrees were granted at University of Maryland-College Park.
Featured schools near , edit
Studying Online at University of Maryland-College Park
Online coursework is an option at University of Maryland-College Park. Of 41,725 students, 1,668 (4%) studied exclusively online and 9,357 (22%) took at least some classes online.
Drama & Theater Arts Rankings at University of Maryland-College Park
These rankings give you a sense of how University of Maryland-College Park’s Drama & Theater Arts program against other schools offering the same major.
Bachelor’s-Level Rankings
| Ranking | Scope | Rank |
|---|---|---|
| Best Schools (Quality) | Maryland | #1 of 3 |
| Best Value | Maryland | #1 of 3 |
| Best Schools (Quality) | Middle Atlantic (Region) | #13 of 70 |
| Best Value | Middle Atlantic (Region) | #14 of 68 |
| Best Schools (Quality) | Nationwide | #64 of 367 |
| Best Value | Nationwide | #135 of 365 |
Master’s-Level Rankings
| Ranking | Scope | Rank |
|---|---|---|
| Best Schools (Quality) | Maryland | #1 of 3 |
| Best Value | Maryland | #1 of 3 |
| Best Schools (Quality) | Middle Atlantic (Region) | #13 of 70 |
| Best Value | Middle Atlantic (Region) | #14 of 68 |
| Best Schools (Quality) | Nationwide | #64 of 367 |
| Best Value | Nationwide | #135 of 365 |
Doctoral-Level Rankings
| Ranking | Scope | Rank |
|---|---|---|
| Best Schools (Quality) | Maryland | #1 of 3 |
| Best Value | Maryland | #1 of 3 |
| Best Schools (Quality) | Middle Atlantic (Region) | #13 of 70 |
| Best Value | Middle Atlantic (Region) | #14 of 68 |
| Best Schools (Quality) | Nationwide | #64 of 367 |
| Best Value | Nationwide | #135 of 365 |
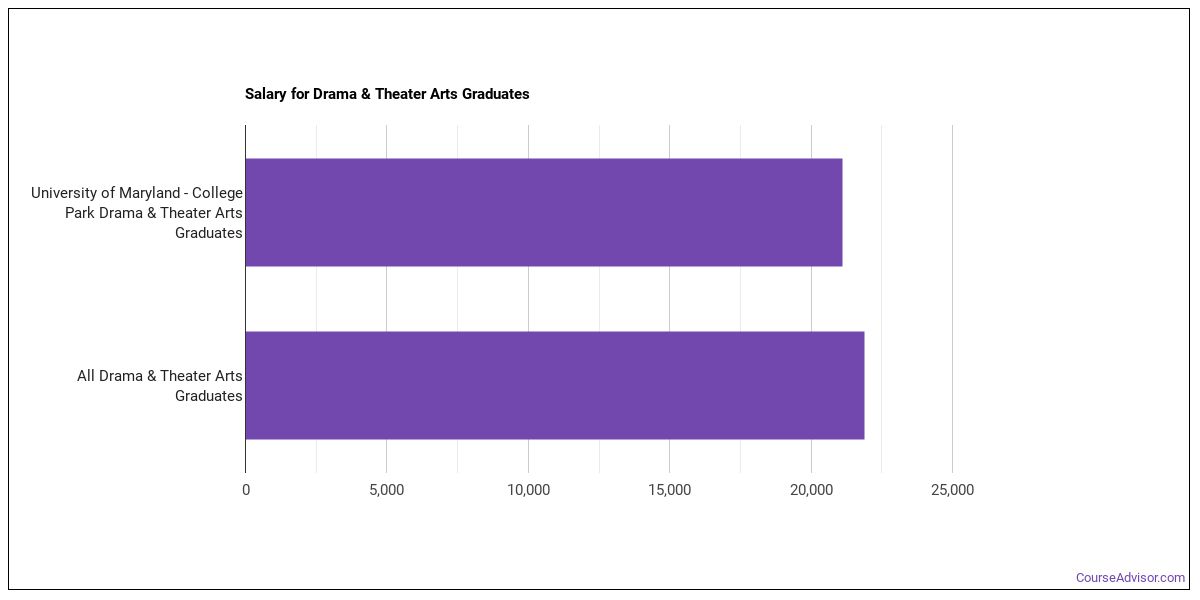
Earnings for Drama & Theater Arts Graduates from University of Maryland-College Park
Graduates of University of Maryland-College Park’s Drama & Theater Arts program earn the following amounts (per the U.S. Department of Education’s College Scorecard):
| Years After Graduation | Median Earnings |
|---|---|
| 1 year | $21,114 |
| 2 years | $21,703 |
| 3 years | $26,413 |
| 4 years | $34,060 |
| 5 years | $38,656 |
How does this compare to the school overall? At the four-year mark, Drama & Theater Arts graduates from University of Maryland-College Park report median earnings of $34,060, compared with $78,942 for all University of Maryland-College Park graduates — about 57% lower than the school-wide median.

Median Debt at Graduation
The median debt for Drama & Theater Arts graduates from University of Maryland-College Park comes in at $20,681.
Student Demographics & Diversity
Below you’ll find the diversity of Drama & Theater Arts graduates at University of Maryland-College Park, broken down by degree level.
Across all degree levels, Drama & Theater Arts graduates at University of Maryland-College Park are 62% women (21) and 38% men (13).
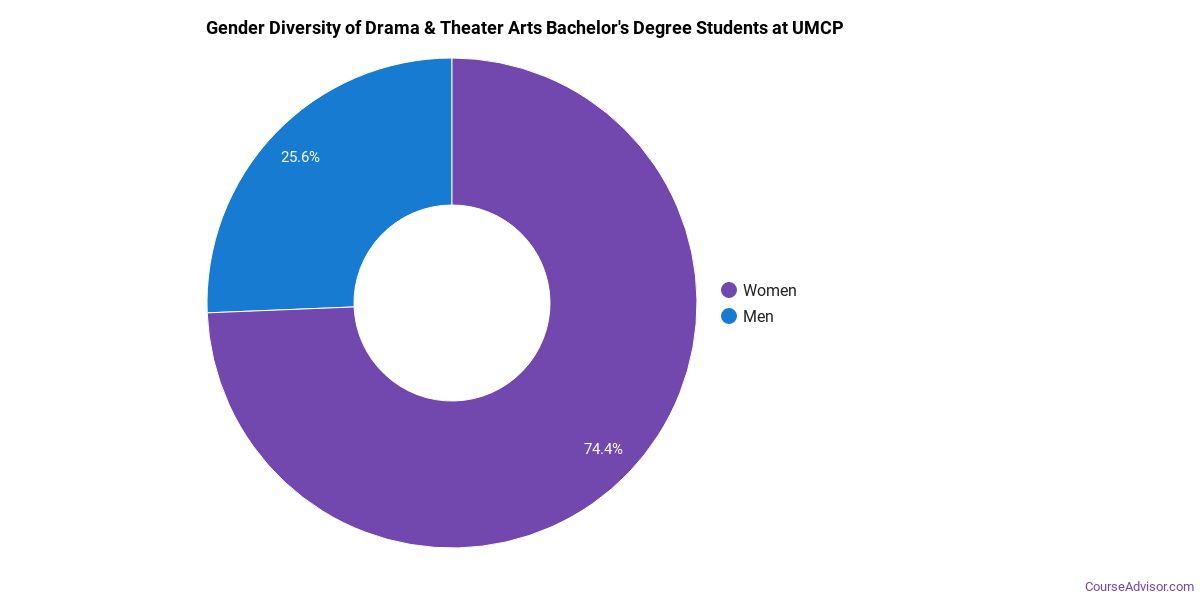
Drama & Theater Arts Bachelor’s Program at University of Maryland-College Park
Of the 19 bachelor’s drama & theater arts graduates at University of Maryland-College Park, 74% were women (14) and 26% were men (5).
The following table and chart show the race/ethnicity of Drama & Theater Arts bachelor’s degree recipients at University of Maryland-College Park.
| Race / Ethnicity | Number of Graduates |
|---|---|
| White | 6 |
| Hispanic / Latino | 1 |
| Black / African American | 6 |
| Asian | 3 |
| Two or More Races | 2 |
| Unknown | 1 |
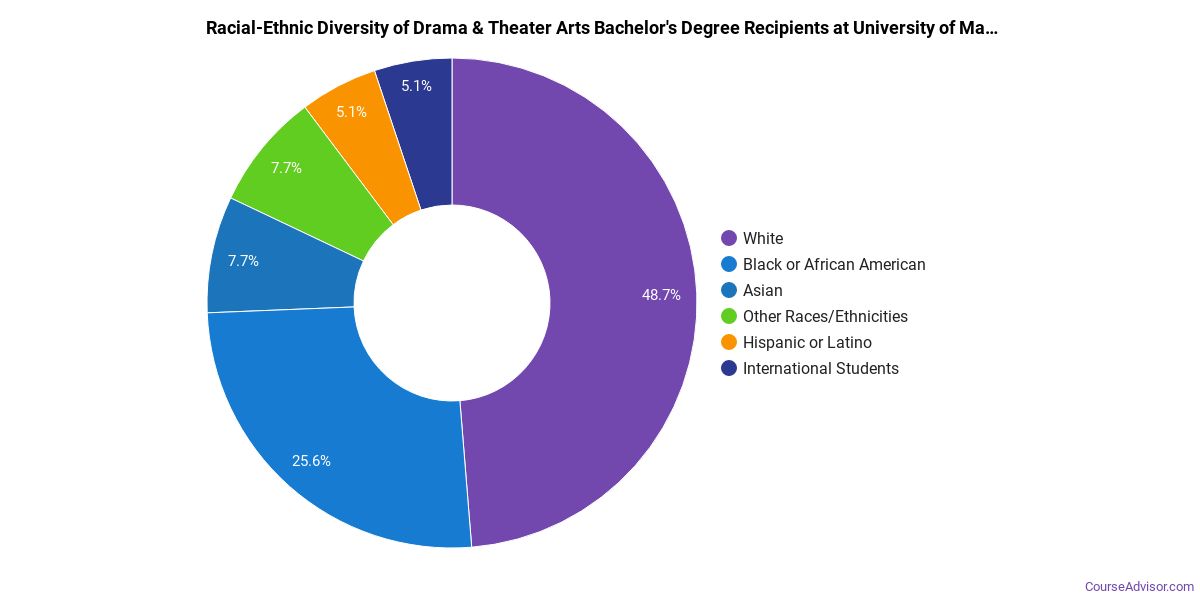
Minority students account for 63% of Drama & Theater Arts bachelor’s degree recipients at University of Maryland-College Park, higher than the national average of 34%.*
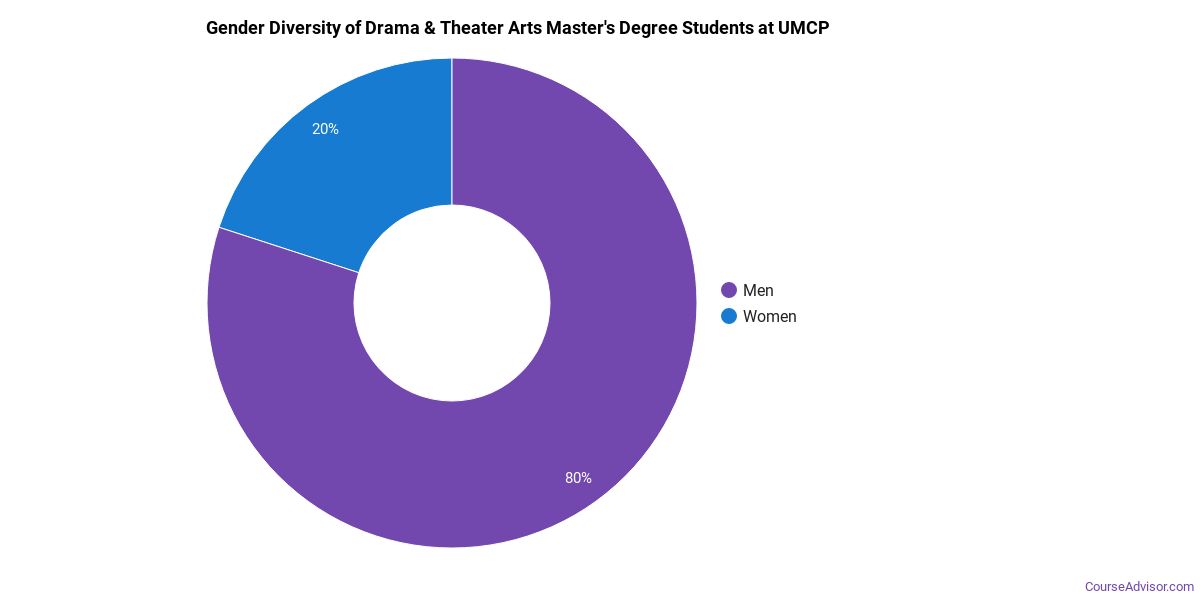
Drama & Theater Arts Master’s Program at University of Maryland-College Park
Among the 12 master’s drama & theater arts degrees awarded at University of Maryland-College Park, 50% were women (6) and 50% were men (6).
The following table and chart show the race/ethnicity of Drama & Theater Arts master’s degree recipients at University of Maryland-College Park.
| Race / Ethnicity | Number of Graduates |
|---|---|
| White | 8 |
| Black / African American | 2 |
| Unknown | 2 |
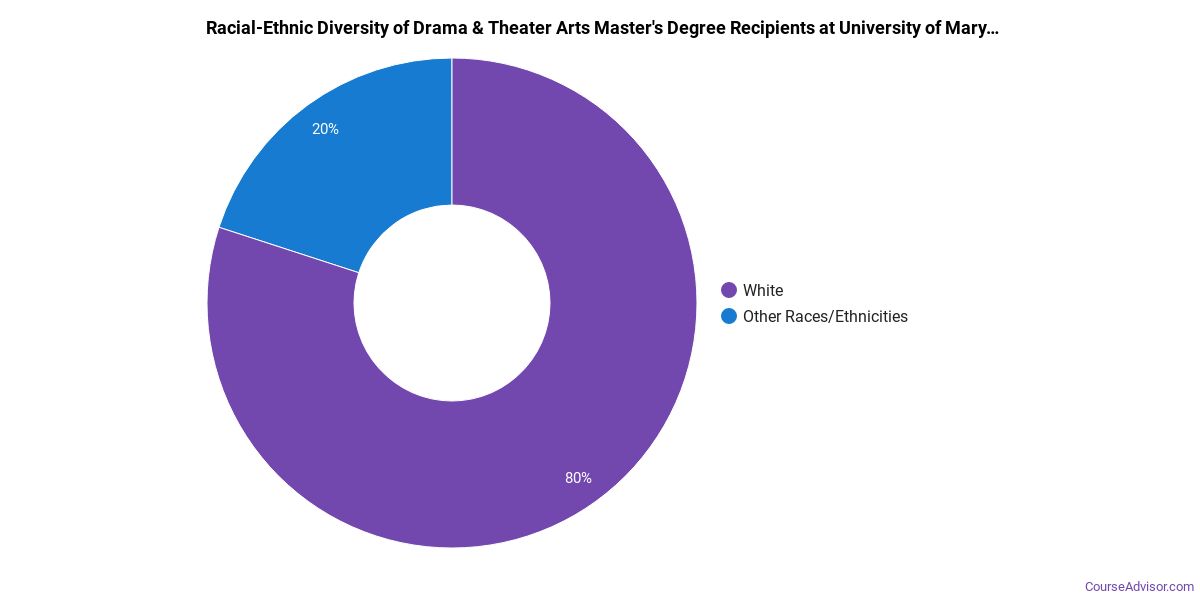
Minority students account for 17% of Drama & Theater Arts master’s degree recipients at University of Maryland-College Park, lower than the national average of 29%.*
Drama & Theater Arts Doctoral Program at University of Maryland-College Park
Among the 3 doctoral drama & theater arts degrees awarded at University of Maryland-College Park, 33% were women (1) and 67% were men (2).

The following table and chart show the race/ethnicity of Drama & Theater Arts doctoral degree recipients at University of Maryland-College Park.
| Race / Ethnicity | Number of Graduates |
|---|---|
| White | 1 |
| Black / African American | 1 |
| Unknown | 1 |

Racial-ethnic minorities make up 33% of Drama & Theater Arts doctoral degree recipients at University of Maryland-College Park, higher than the national average of 24%.*
*The racial-ethnic minorities figure is the total number of graduates minus White, international (nonresident), and unknown-race graduates.
More Specific Drama & Theater Arts Concentrations at University of Maryland-College Park
The Drama & Theater Arts program at University of Maryland-College Park includes the following sub-specializations:
| Concentration | Graduates |
|---|---|
| Theater Arts | 19 |
| Theater Design & Technology | 11 |
| Theatre Literature & History | 4 |
Highest-Paying Careers for Drama & Theater Arts Graduates
Graduates of the Drama & Theater Arts program at University of Maryland-College Park work across a variety of fields. Here are the highest-paying careers for Drama & Theater Arts majors, ordered by median annual salary:
| Occupation | Nationwide Median Wage |
|---|---|
| Choreographers | $109,380 |
| Set and Exhibit Designers | $109,049 |
| Musicians and Singers | $96,571 |
| Media Programming Directors | $90,799 |
| Producers and Directors | $90,515 |
| Dancers | $74,180 |
| Talent Directors | $73,937 |
| Poets, Lyricists and Creative Writers | $70,619 |
| Music Directors and Composers | $66,915 |
| Media Technical Directors/Managers | $65,049 |
References
- IPEDS — Integrated Postsecondary Education Data System
- U.S. Department of Education — College Scorecard
- O*NET Online (Bureau of Labor Statistics)
- National Center for Education Statistics
More about our data sources and methodologies.
Course Advisor provides higher-education, college and university, degree, program, career, salary, and other helpful information to students, faculty, institutions, and other internet audiences. Presented information and data are subject to change. Inclusion on this website does not imply or represent a direct relationship with the company, school, or brand. Information, though believed correct at time of publication, may not be correct, and no warranty is provided. Contact the schools to verify any information before relying on it. Financial aid may be available for those who qualify. The displayed options may include sponsored or recommended results, not necessarily based on your preferences.
© Course Advisor – All Rights Reserved.