Drama & Theater Arts at University of Cincinnati-Main Campus
If you are interested in studying Drama & Theater Arts, you may want to check out the program at University of Cincinnati-Main Campus. We’ve gathered the following information to help you decide.
University of Cincinnati-Main Campus sits in Cincinnati, OH.
During the most recent reporting year, 110 drama & theater arts degrees were granted at University of Cincinnati-Main Campus.
Featured schools near , edit
Studying Online at University of Cincinnati-Main Campus
Online coursework is an option at University of Cincinnati-Main Campus. Among 45,026 students, 9,022 (20%) were enrolled entirely in distance education and 19,145 (43%) took at least some classes online.
Drama & Theater Arts Rankings at University of Cincinnati-Main Campus
Use these rankings to compare University of Cincinnati-Main Campus’s Drama & Theater Arts program against other schools offering the same major.
Bachelor’s-Level Rankings
| Ranking | Scope | Rank |
|---|---|---|
| Best Schools (Quality) | Ohio | #3 of 13 |
| Best Value | Ohio | #8 of 13 |
| Best Schools (Quality) | Great Lakes (Region) | #19 of 49 |
| Best Value | Great Lakes (Region) | #37 of 49 |
| Best Schools (Quality) | Nationwide | #89 of 367 |
| Best Value | Nationwide | #258 of 365 |
Master’s-Level Rankings
| Ranking | Scope | Rank |
|---|---|---|
| Best Schools (Quality) | Ohio | #3 of 13 |
| Best Value | Ohio | #8 of 13 |
| Best Schools (Quality) | Great Lakes (Region) | #19 of 49 |
| Best Value | Great Lakes (Region) | #37 of 49 |
| Best Schools (Quality) | Nationwide | #89 of 367 |
| Best Value | Nationwide | #258 of 365 |
Earnings for Drama & Theater Arts Graduates from University of Cincinnati-Main Campus
Graduates of University of Cincinnati-Main Campus’s Drama & Theater Arts program earn at the following median levels (per the U.S. Department of Education’s College Scorecard):
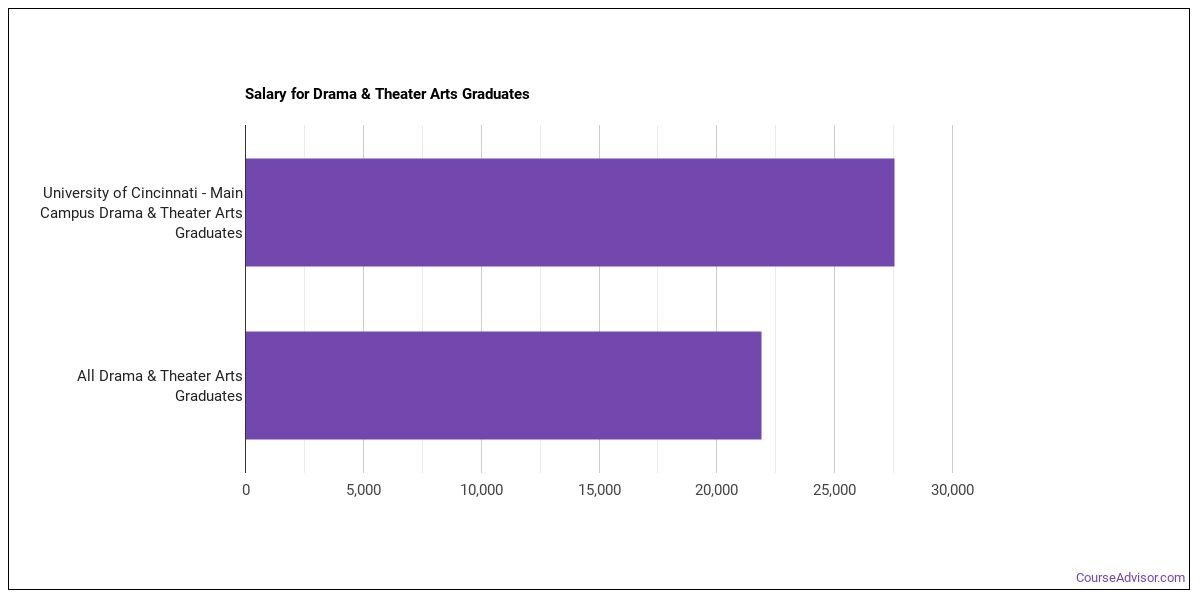
| Years After Graduation | Median Earnings |
|---|---|
| 1 year | $27,520 |
| 2 years | $23,456 |
| 3 years | $37,415 |
| 4 years | $22,906 |
| 5 years | $35,509 |
How do these earnings stack up against the rest of the school? At the four-year mark, Drama & Theater Arts graduates from University of Cincinnati-Main Campus earn a median of $22,906, compared with $66,139 for all University of Cincinnati-Main Campus graduates — about 65% lower than the school-wide median.

Median Debt at Graduation
Typical debt at graduation for Drama & Theater Arts graduates from University of Cincinnati-Main Campus comes in at $25,980.
Student Demographics & Diversity
The following sections describe the diversity of Drama & Theater Arts graduates at University of Cincinnati-Main Campus, by degree type.
Looking at the program as a whole, Drama & Theater Arts graduates at University of Cincinnati-Main Campus are 55% women (61) and 45% men (49).
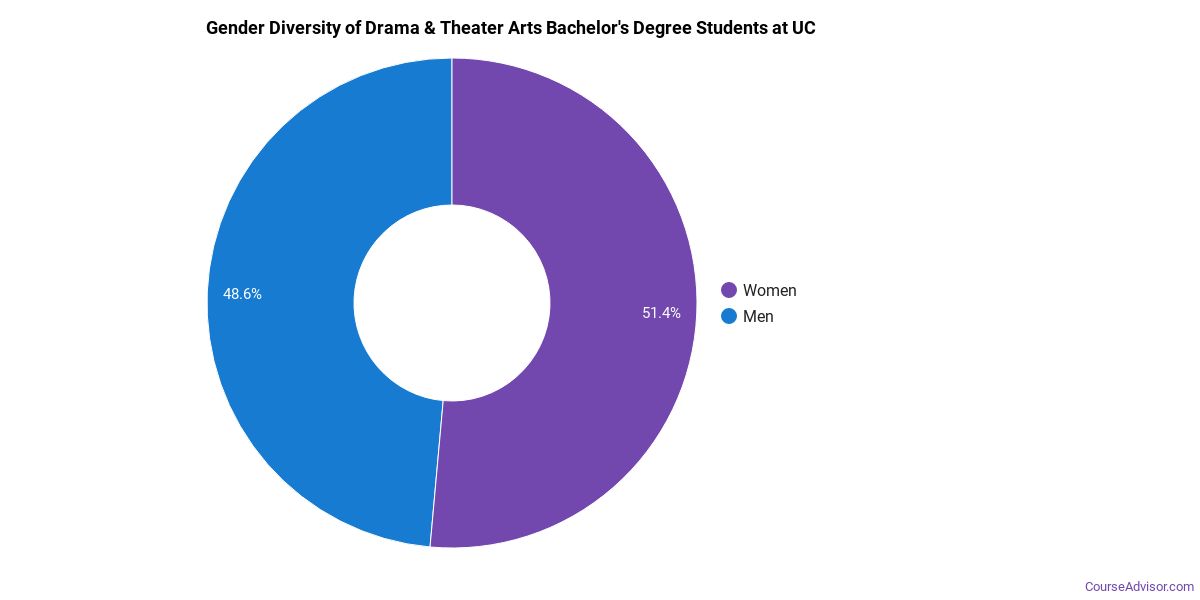
Drama & Theater Arts Bachelor’s Program at University of Cincinnati-Main Campus
Of the 51 bachelor’s drama & theater arts graduates at University of Cincinnati-Main Campus, 57% were women (29) and 43% were men (22).
The following table and chart show the race/ethnicity of Drama & Theater Arts bachelor’s degree recipients at University of Cincinnati-Main Campus.
| Race / Ethnicity | Number of Graduates |
|---|---|
| White | 39 |
| Hispanic / Latino | 3 |
| Black / African American | 2 |
| Asian | 1 |
| Two or More Races | 4 |
| Unknown | 2 |
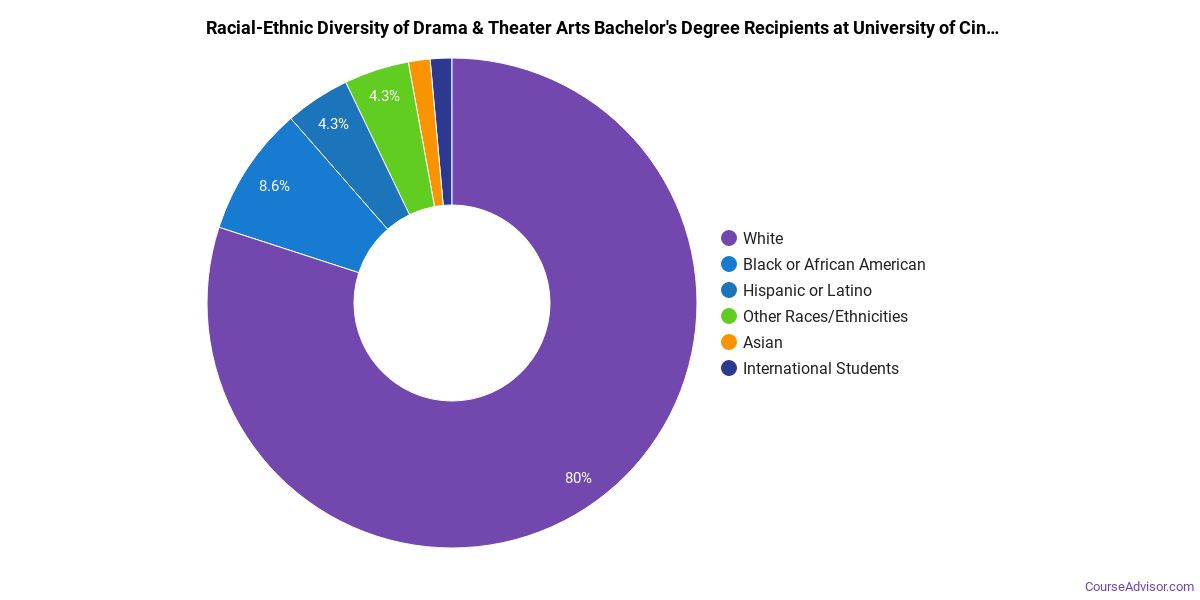
Racial-ethnic minorities make up 20% of Drama & Theater Arts bachelor’s degree recipients at University of Cincinnati-Main Campus, below the national average of 34%.*
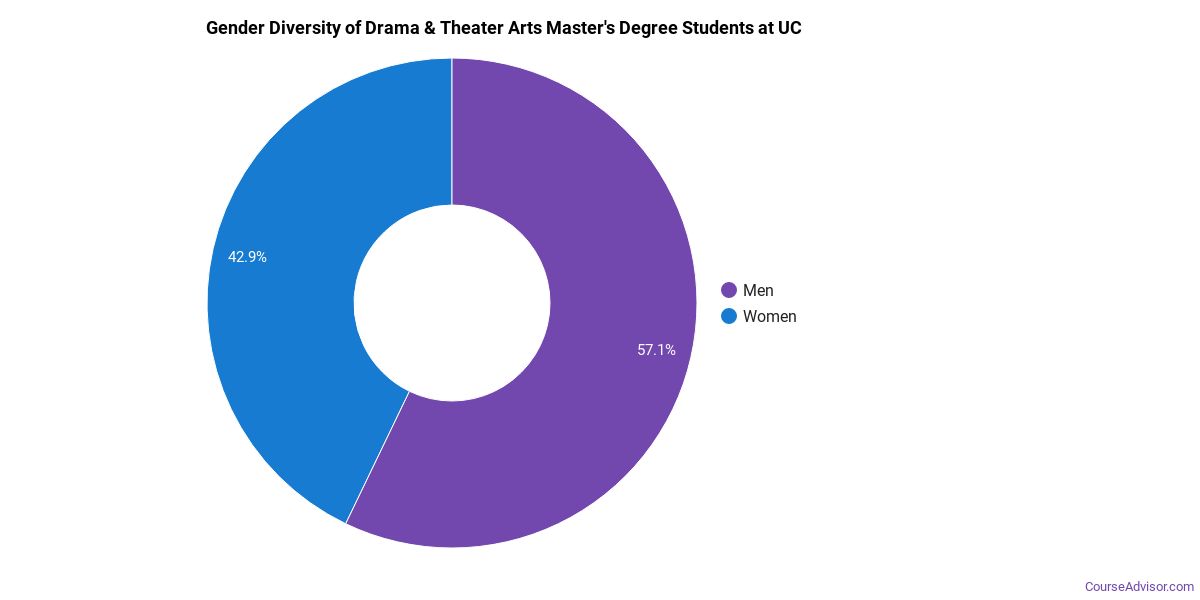
Drama & Theater Arts Master’s Program at University of Cincinnati-Main Campus
Among the 9 master’s drama & theater arts graduates at University of Cincinnati-Main Campus, 78% were women (7) and 22% were men (2).
The following table and chart show the race/ethnicity of Drama & Theater Arts master’s degree recipients at University of Cincinnati-Main Campus.
| Race / Ethnicity | Number of Graduates |
|---|---|
| White | 6 |
| Black / African American | 1 |
| Two or More Races | 1 |
| International (Nonresident) | 1 |
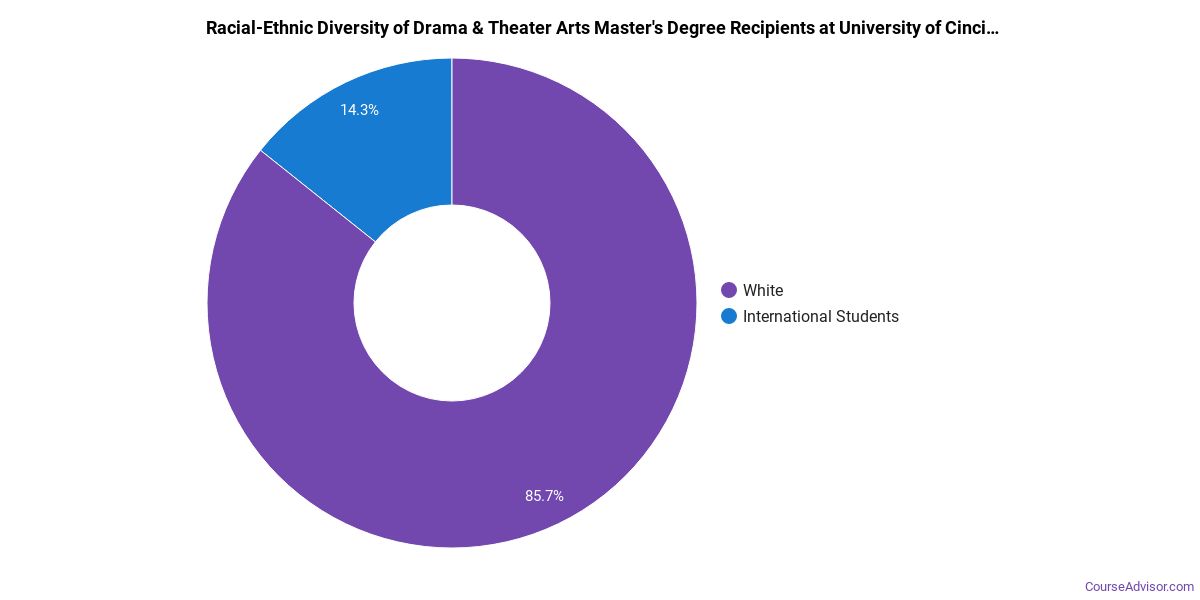
Minority students account for 22% of Drama & Theater Arts master’s degree recipients at University of Cincinnati-Main Campus, below the national average of 29%.*
*The racial-ethnic minorities figure is the total number of graduates minus White, international (nonresident), and unknown-race graduates.
More Specific Drama & Theater Arts Concentrations at University of Cincinnati-Main Campus
The Drama & Theater Arts program at University of Cincinnati-Main Campus offers more specialized concentrations:
| Concentration | Graduates |
|---|---|
| Theater Arts | 14 |
| Theater Design & Technology | 36 |
| Playwriting & Screenwriting | 29 |
| Acting | 10 |
| Directing & Theatrical Production | 21 |
Best-Paid Careers for Drama & Theater Arts Graduates
Students who finish Drama & Theater Arts program at University of Cincinnati-Main Campus pursue many career paths. Below are the highest-paying careers for Drama & Theater Arts graduates, ordered by median annual salary:
| Occupation | Nationwide Median Wage |
|---|---|
| Choreographers | $109,380 |
| Set and Exhibit Designers | $109,049 |
| Musicians and Singers | $96,571 |
| Media Programming Directors | $90,799 |
| Producers and Directors | $90,515 |
| Dancers | $74,180 |
| Talent Directors | $73,937 |
| Poets, Lyricists and Creative Writers | $70,619 |
| Music Directors and Composers | $66,915 |
| Media Technical Directors/Managers | $65,049 |
References
- IPEDS — Integrated Postsecondary Education Data System
- U.S. Department of Education — College Scorecard
- O*NET Online (Bureau of Labor Statistics)
- National Center for Education Statistics
More about our data sources and methodologies.
Course Advisor provides higher-education, college and university, degree, program, career, salary, and other helpful information to students, faculty, institutions, and other internet audiences. Presented information and data are subject to change. Inclusion on this website does not imply or represent a direct relationship with the company, school, or brand. Information, though believed correct at time of publication, may not be correct, and no warranty is provided. Contact the schools to verify any information before relying on it. Financial aid may be available for those who qualify. The displayed options may include sponsored or recommended results, not necessarily based on your preferences.
© Course Advisor – All Rights Reserved.