Agricultural Economics at Texas State University
If you are interested in studying Agricultural Economics, you may want to check out the program at Texas State University. Get started with the following essential facts.
Texas State University is located in San Marcos, TX.
In the most recent year for which we have data, 17 agricultural economics degrees were awarded at Texas State University.
Featured schools near , edit
Online & Distance Learning at Texas State University
Many students take online classes at Texas State University. Of 40,674 students, 2,395 (6%) were enrolled entirely in distance education and 15,927 (39%) took at least some classes online.
Agricultural Economics Rankings at Texas State University
Use these rankings to compare Texas State University’s Agricultural Economics program against peer institutions.
Bachelor’s-Level Rankings
| Ranking | Scope | Rank |
|---|---|---|
| Best Value | Texas | #8 of 14 |
| Best Schools (Quality) | Texas | #12 of 14 |
| Best Value | Southwest (Region) | #14 of 20 |
| Best Schools (Quality) | Southwest (Region) | #15 of 20 |
| Best Value | Nationwide | #121 of 157 |
| Best Schools (Quality) | Nationwide | #139 of 157 |
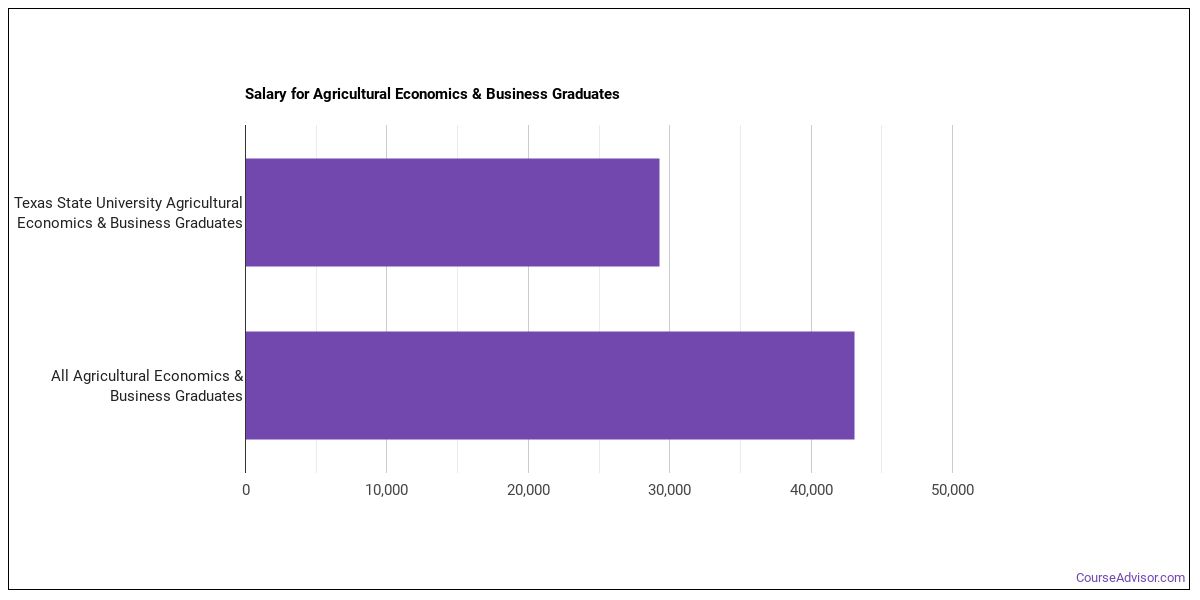
Earnings for Agricultural Economics Graduates from Texas State University
Students who complete Texas State University’s Agricultural Economics program earn the following amounts (per the U.S. Department of Education’s College Scorecard):
| Years After Graduation | Median Earnings |
|---|---|
| 1 year | $29,273 |
| 2 years | $33,993 |
| 3 years | $46,855 |
| 4 years | $50,978 |
| 5 years | $57,287 |
How does this compare to the school overall? Four years after graduating, Agricultural Economics graduates from Texas State University take home a median $50,978, compared with $55,350 for all Texas State University graduates — about 8% lower than the school-wide median.

Median Debt at Graduation
Typical debt at graduation for Agricultural Economics graduates from Texas State University stands at $20,500.
Student Demographics & Diversity
Below you’ll find the diversity of Agricultural Economics graduates at Texas State University, broken down by degree level.
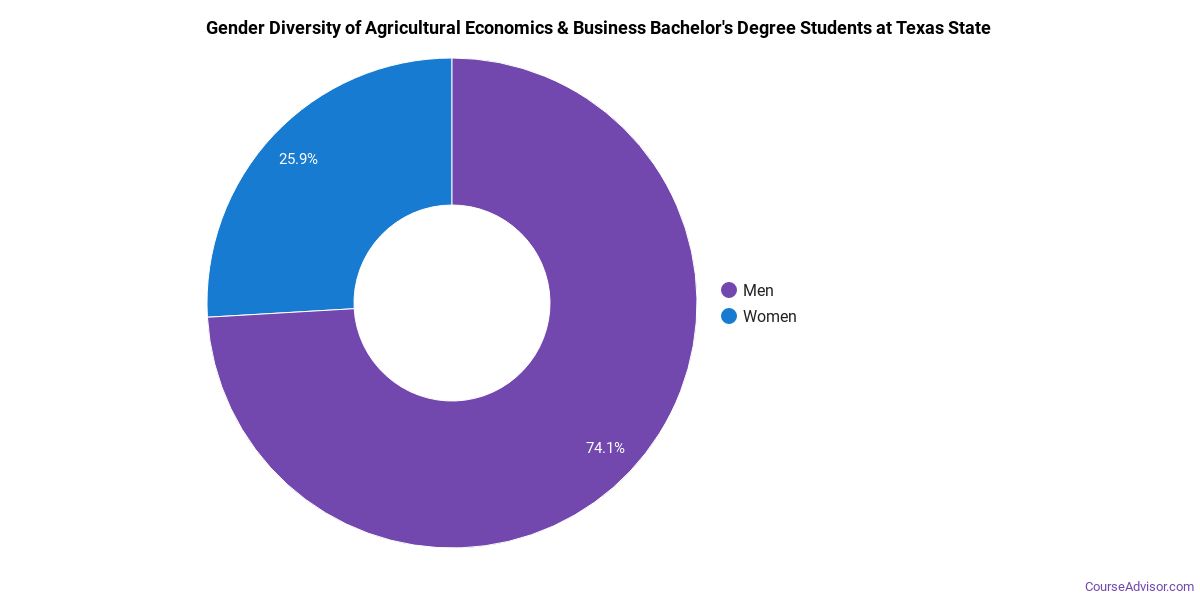
Looking at the program as a whole, Agricultural Economics graduates at Texas State University are 41% women (7) and 59% men (10).
Agricultural Economics Bachelor’s Program at Texas State University
Among the 17 bachelor’s agricultural economics graduates at Texas State University, 41% were women (7) and 59% were men (10).
The following table and chart show the race/ethnicity of Agricultural Economics bachelor’s degree recipients at Texas State University.
| Race / Ethnicity | Number of Graduates |
|---|---|
| White | 11 |
| Hispanic / Latino | 6 |
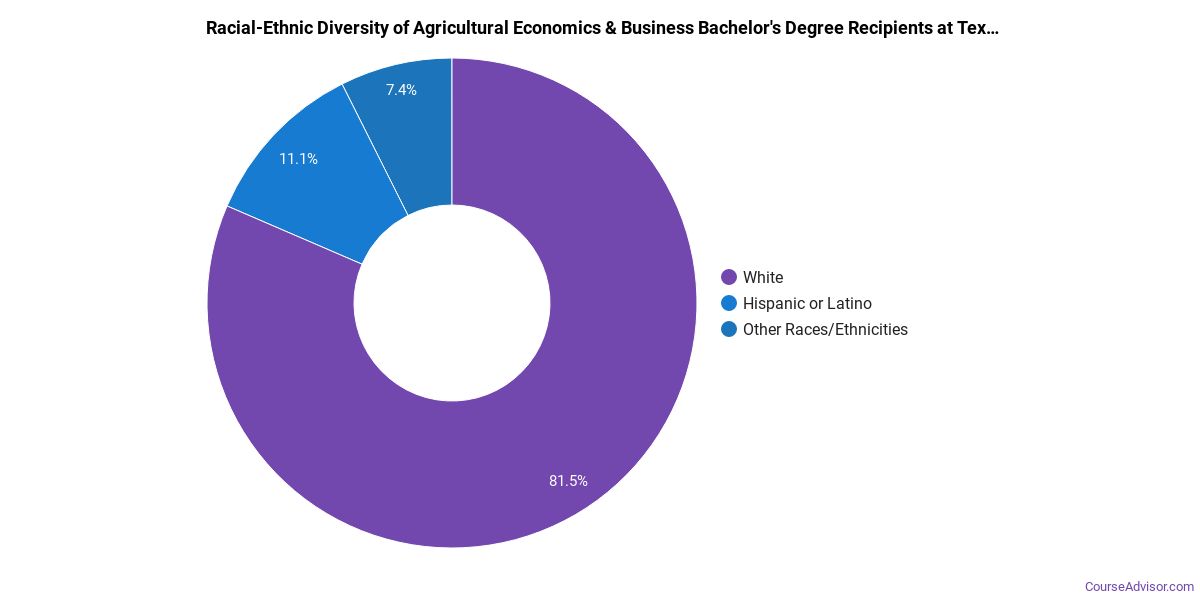
Racial-ethnic minorities make up 35% of Agricultural Economics bachelor’s degree recipients at Texas State University, higher than the national average of 19%.*
*The racial-ethnic minorities figure is the total number of graduates minus White, international (nonresident), and unknown-race graduates.
More Specific Agricultural Economics Concentrations at Texas State University
The Agricultural Economics program at Texas State University offers more specialized concentrations:
| Concentration | Graduates |
|---|---|
| Agricultural Business Operations | 17 |
Highest-Paying Careers for Agricultural Economics Graduates
Graduates of the Agricultural Economics program at Texas State University go on to a range of careers. Here are the top-paying careers for Agricultural Economics graduates, ordered by median annual salary:
| Occupation | Nationwide Median Wage |
|---|---|
| Buyers and Purchasing Agents, Farm Products | $109,813 |
| Environmental Economists | $86,726 |
| Farmers, Ranchers, and Other Agricultural Managers | $84,680 |
| Economists | $73,611 |
| Computer User Support Specialists | $71,530 |
| Economics Teachers, Postsecondary | $69,831 |
| Agricultural Sciences Teachers, Postsecondary | $66,903 |
| Farm and Home Management Educators | $55,950 |
| First-Line Supervisors of Farming, Fishing, and Forestry Workers | $36,803 |
| Sales Representatives, Wholesale and Manufacturing, Except Technical and Scientific Products | $29,657 |
References
- IPEDS — Integrated Postsecondary Education Data System
- U.S. Department of Education — College Scorecard
- O*NET Online (Bureau of Labor Statistics)
- National Center for Education Statistics
More about our data sources and methodologies.
Course Advisor provides higher-education, college and university, degree, program, career, salary, and other helpful information to students, faculty, institutions, and other internet audiences. Presented information and data are subject to change. Inclusion on this website does not imply or represent a direct relationship with the company, school, or brand. Information, though believed correct at time of publication, may not be correct, and no warranty is provided. Contact the schools to verify any information before relying on it. Financial aid may be available for those who qualify. The displayed options may include sponsored or recommended results, not necessarily based on your preferences.
© Course Advisor – All Rights Reserved.