Texas State University Science & Tech Programs
Texas State University is a public institution located in San Marcos, TX. A Smaller City provides an ideal setting with access to urban amenities.
Featured schools near , edit
Texas State University Rankings
Texas State University has earned the following rankings for science & tech programs at the bachelors level:
| Ranking | Rank | Among |
|---|---|---|
| Overall Quality | #20 of 309 | State — Texas |
| Overall Quality | #25 of 484 | Region — Southwest |
| Overall Quality | #398 of 4,630 | Nationwide |
Where Is Texas State University?
Contact details for Texas State University are given below.
| Contact Details | |
|---|---|
| Address: | 601 University Dr, San Marcos, TX 78666 |
| Phone: | 5122452111 |
| Website: | www.txst.edu/ |
| Admissions: | www.txst.edu/admissions.html |
| Financial Aid: | www.finaid.txst.edu/ |
How Do I Get Into Texas State University?
You can apply to Texas State University online at: https://www.applytexas.org/
Texas State University is classified as Least Selective (85%+) for admissions.
Admission Requirements for Texas State University
This is what Texas State University considers when reviewing applications:
| Requirement | Status |
|---|---|
| Secondary School Record | Required |
| Secondary School GPA | Neither required nor recommended |
| Recommendations | Neither required nor recommended |
| Admission Test Scores (SAT/ACT) | Required |
How Hard Is It To Get Into Texas State University?
Texas State University admits 89%, making it highly accessible. Be sure to prepare a complete application and prepare the application in full.
Of those admitted, 27% choose to enroll — a typical enrollment-to-admission yield.
Average Test Scores
41% of admitted students submitted SAT scores and 6% submitted ACT scores.
When looking at the 25th through the 75th percentile of admitted students at Texas State University, SAT Evidence-Based Reading and Writing scores ranged between 500 and 610. Math scores were between 480 and 590.
Selectivity by Gender
Selectivity numbers at Texas State University can differ by gender.
| Gender | Applicants | Admitted | Acceptance Rate |
|---|---|---|---|
| Men | 12,850 | 11,133 | 87% |
| Women | 21,152 | 19,241 | 91% |
Can I Afford Texas State University?
The average net price after aid at Texas State University is $16,438. The affordability of the school largely depends on your financial need since net price varies by income group.
Tuition & Fees
| Category | Cost |
|---|---|
| In-State Tuition | $8,606 |
| In-State Fees | $2,844 |
| Out-of-State Tuition | $20,086 |
| Out-of-State Fees | $2,844 |
| Total In-State Tuition & Fees | $11,450 |
| Total Out-of-State Tuition & Fees | $22,930 |
Financial Aid
Across all aid types, 22% of students at Texas State University receive some form of financial aid (7,668 students).
Approximately 60% of students at Texas State University receive grant or scholarship aid, averaging $9,539 per student.
37% of students receive federal Pell Grants, averaging $5,559.
Student Loan Debt
41% of Texas State University undergraduates take out federal student loans, averaging $6,168 per year.
Texas State University Undergraduate Student Diversity
There are 5,063 students enrolled at Texas State University. Texas State University is classified as a 20,000 and above institution by enrollment size. Its Carnegie Classification is Doctoral Universities: Higher Research Activity.
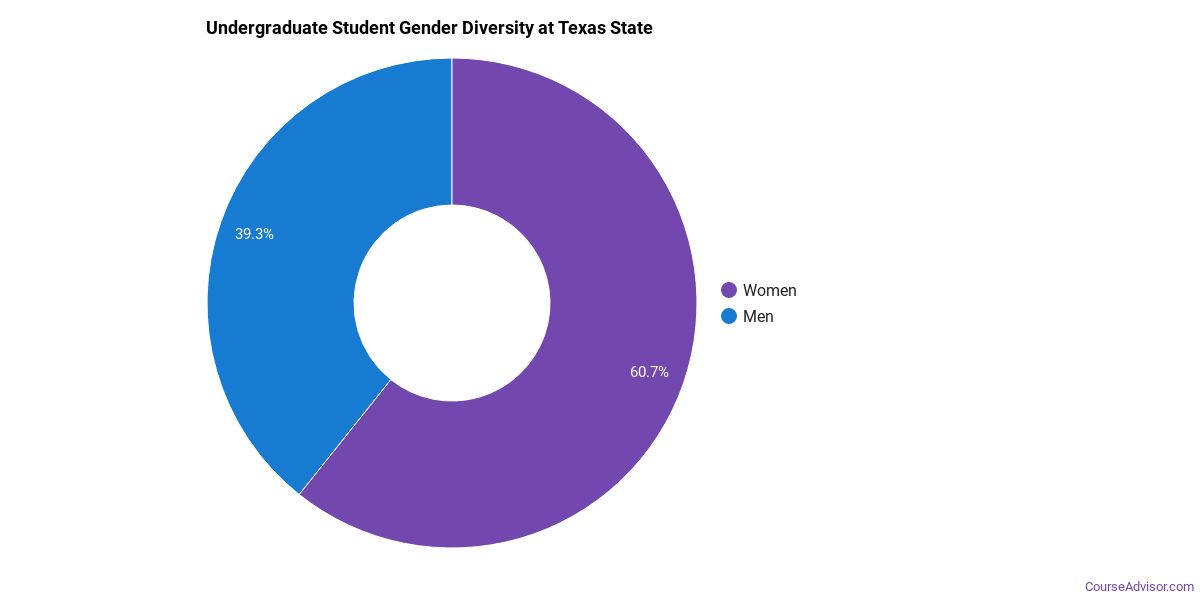
Gender Diversity
Of the 34,547 undergraduate students at Texas State University, approximately 41% are male and 59% are female.
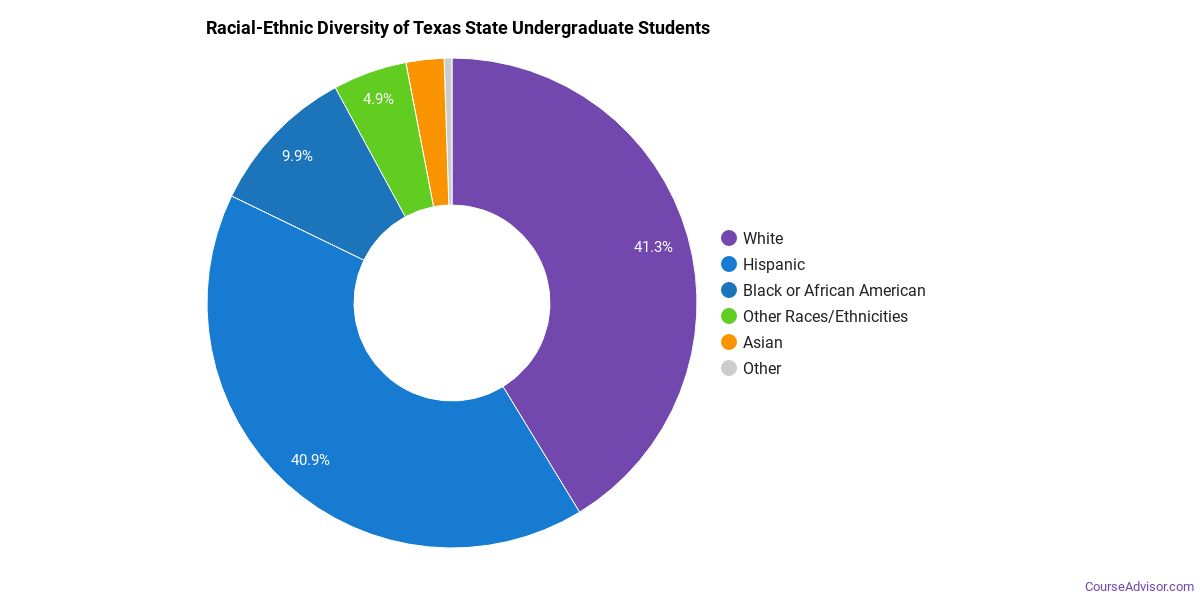
Racial-Ethnic Diversity
The racial-ethnic breakdown of Texas State University undergraduate students is as follows.
| Race/Ethnicity | Number of Students |
|---|---|
| Asian | 967 |
| Black or African American | 3,281 |
| Hispanic | 14,198 |
| White | 12,575 |
| American Indian/Alaska Native | 103 |
| Native Hawaiian/Pacific Islander | 34 |
| Two or More Races | 1,070 |
| Non-Resident | 690 |
Geographic Diversity
The top 5 home states of first-time undergraduate students at Texas State University break down as follows.

| State | First-Time UG Students |
|---|---|
| Texas | 7,652 |
| California | 17 |
| Illinois | 11 |
| Virginia | 10 |
| Colorado | 9 |
Additionally, approximately 2.0% of undergraduate students are non-resident from outside the United States.
Texas State University Graduate Student Diversity
4,175 of Texas State University’s students are in graduate programs. The highest graduate-level award offered is Doctor’s degree.
Gender Diversity (Graduate)
Among graduate students at Texas State University, approximately 36% are male and 64% are female.

Racial-Ethnic Diversity (Graduate)
The racial-ethnic breakdown of Texas State University graduate students is as follows.

| Race/Ethnicity | Number of Students |
|---|---|
| Asian | 133 |
| Black or African American | 304 |
| Hispanic | 1,239 |
| White | 1,565 |
| American Indian/Alaska Native | 4 |
| Native Hawaiian/Pacific Islander | 4 |
| Two or More Races | 108 |
| Non-Resident | 722 |
Online Learning at Texas State University
Texas State University offers online programs for students who need flexibility.
15,093 undergraduate students at Texas State University took at least one online class — of those, 1,451 took all of their classes online.
At the graduate level, 834 students took at least one online class and 944 took all classes online. Distance education is available at the undergraduate and graduate levels.
Science & Tech Programs at Texas State University
These science & tech majors are available at Texas State University, with the number of degrees awarded at each level in the most recent reporting year.
| Program | Bachelor’s | Master’s | Doctorate | Total |
|---|---|---|---|---|
| City/Urban, Community, and Regional Planning | 12 | — | — | 12 |
Academic Programs at Texas State University
Texas State University offers 29 distinct academic programs.
The highest level of award offered is Doctor’s degree.
Institutional Profile
Texas State University maintains an open admission policy: No. Credit transfer:
- AP credits: Yes
- Dual enrollment credits: Yes
- Life experience credits: Implied no
References
More about our data sources and methodologies.
Course Advisor provides higher-education, college and university, degree, program, career, salary, and other helpful information to students, faculty, institutions, and other internet audiences. Presented information and data are subject to change. Inclusion on this website does not imply or represent a direct relationship with the company, school, or brand. Information, though believed correct at time of publication, may not be correct, and no warranty is provided. Contact the schools to verify any information before relying on it. Financial aid may be available for those who qualify. The displayed options may include sponsored or recommended results, not necessarily based on your preferences.
© Course Advisor – All Rights Reserved.