Biochemistry & Biophysics at Pennsylvania State University-Main Campus
If you plan to study Biochemistry & Biophysics, take a look at what Pennsylvania State University-Main Campus. The following information will help you decide if it is a good fit for you.
Pennsylvania State University-Main Campus sits in University Park, PA.
In the most recent year for which we have data, 104 biochemistry & biophysics degrees were granted at Pennsylvania State University-Main Campus.
Featured schools near , edit
Studying Online at Pennsylvania State University-Main Campus
Online coursework is an option at Pennsylvania State University-Main Campus. Among 50,737 students, 321 (1%) were enrolled entirely in distance education and 20,178 (40%) took at least some classes online.
Student Demographics & Diversity
Below you’ll find the composition of Biochemistry & Biophysics graduates at Pennsylvania State University-Main Campus, broken down by degree level.
Program-wide, Biochemistry & Biophysics graduates at Pennsylvania State University-Main Campus are 57% women (59) and 43% men (45).
Biochemistry & Biophysics Bachelor’s Program at Pennsylvania State University-Main Campus
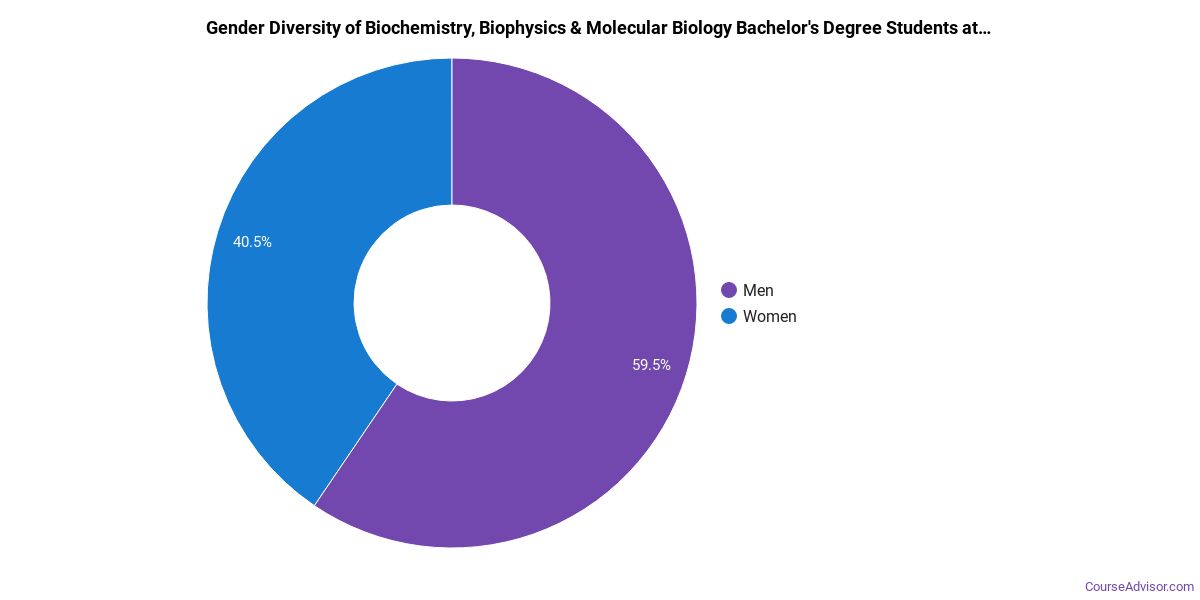
Among the 93 bachelor’s biochemistry & biophysics degrees awarded at Pennsylvania State University-Main Campus, 57% were women (53) and 43% were men (40).
The following table and chart show the race/ethnicity of Biochemistry & Biophysics bachelor’s degree recipients at Pennsylvania State University-Main Campus.
| Race / Ethnicity | Number of Graduates |
|---|---|
| White | 53 |
| Hispanic / Latino | 6 |
| Black / African American | 6 |
| Asian | 13 |
| Two or More Races | 3 |
| International (Nonresident) | 4 |
| Unknown | 8 |
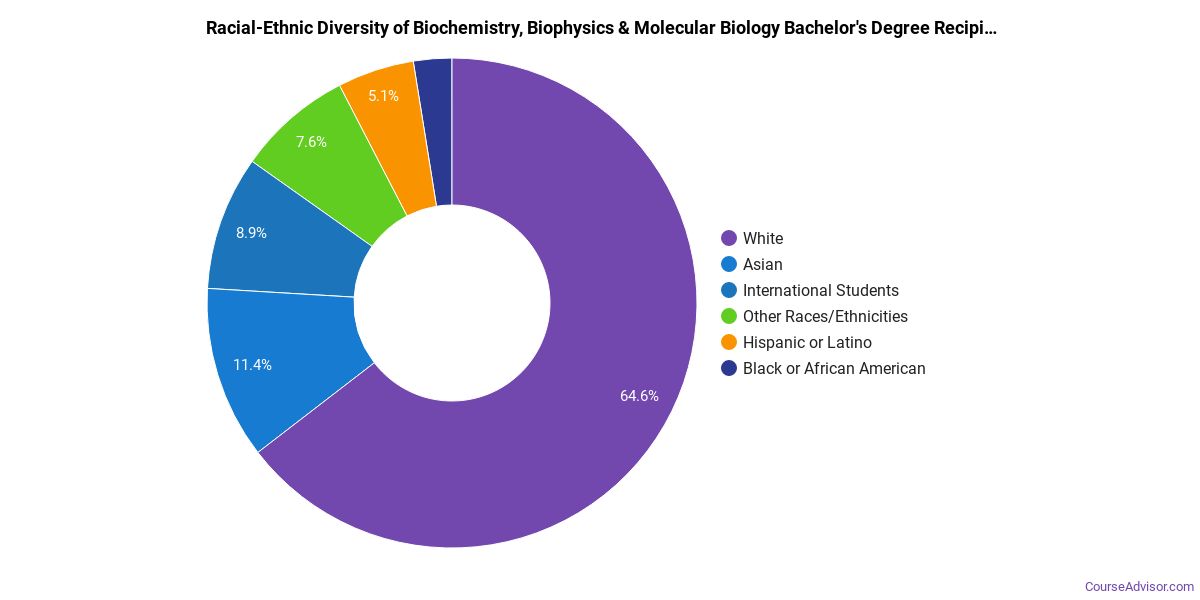
Racial-ethnic minorities make up 30% of Biochemistry & Biophysics bachelor’s degree recipients at Pennsylvania State University-Main Campus, below the national average of 43%.*
Biochemistry & Biophysics Master’s Program at Pennsylvania State University-Main Campus
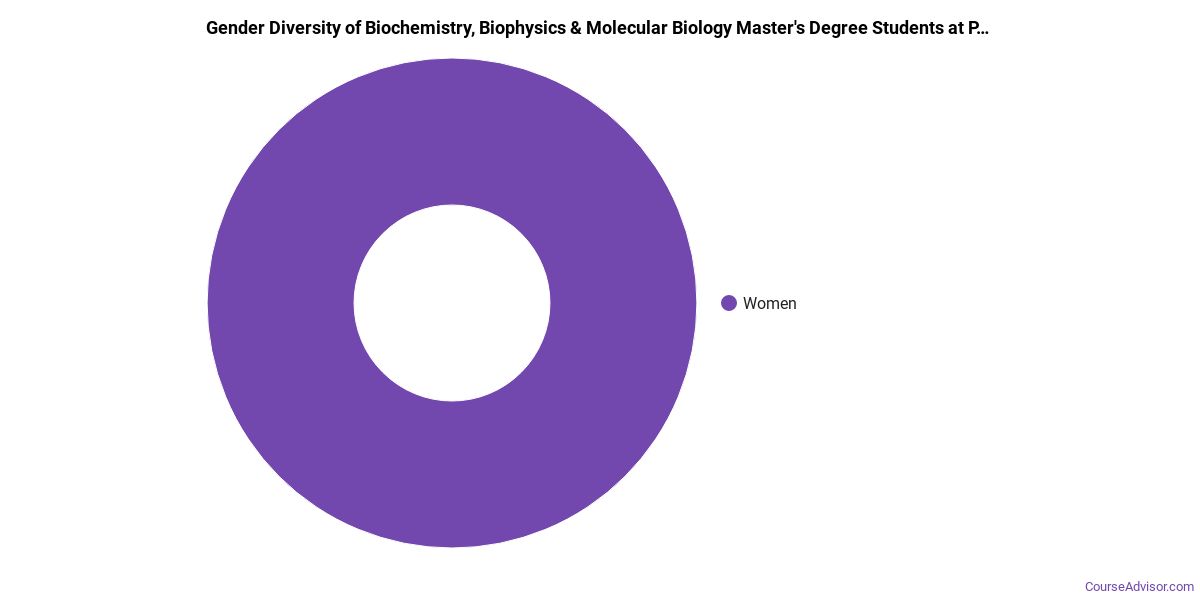
Of the 3 master’s biochemistry & biophysics graduates at Pennsylvania State University-Main Campus, 33% were women (1) and 67% were men (2).
The following table and chart show the race/ethnicity of Biochemistry & Biophysics master’s degree recipients at Pennsylvania State University-Main Campus.
| Race / Ethnicity | Number of Graduates |
|---|---|
| White | 1 |
| Hispanic / Latino | 1 |
| International (Nonresident) | 1 |
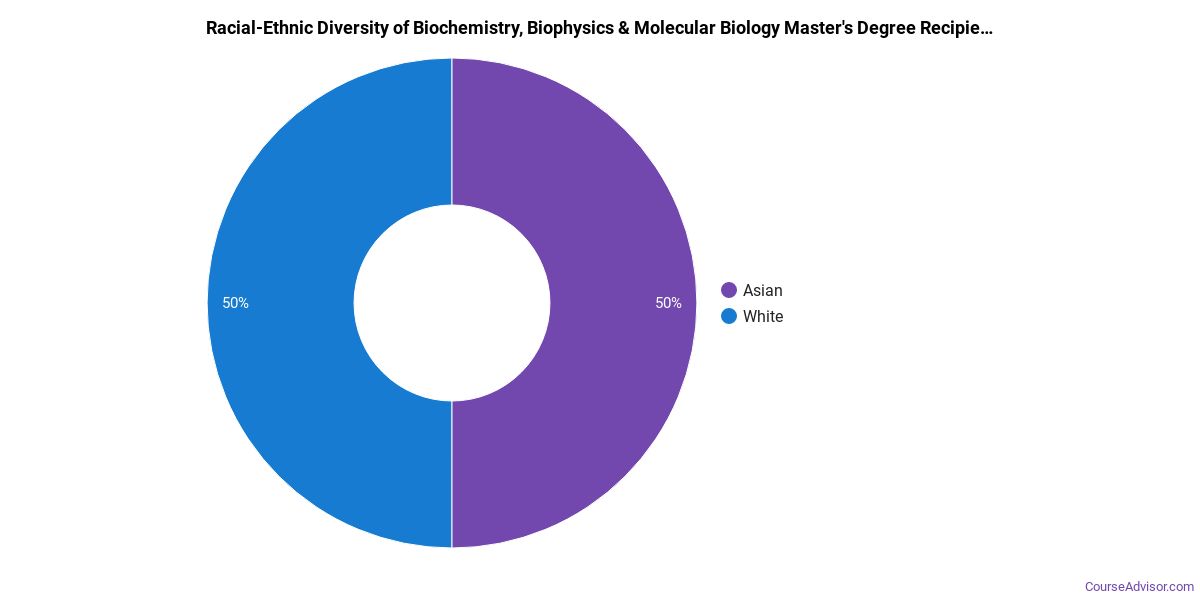
Minority students account for 33% of Biochemistry & Biophysics master’s degree recipients at Pennsylvania State University-Main Campus, lower than the national average of 37%.*
Biochemistry & Biophysics Doctoral Program at Pennsylvania State University-Main Campus
Among the 8 doctoral biochemistry & biophysics degrees awarded at Pennsylvania State University-Main Campus, 62% were women (5) and 38% were men (3).

The following table and chart show the race/ethnicity of Biochemistry & Biophysics doctoral degree recipients at Pennsylvania State University-Main Campus.
| Race / Ethnicity | Number of Graduates |
|---|---|
| White | 2 |
| Black / African American | 3 |
| Asian | 1 |
| International (Nonresident) | 2 |

Racial-ethnic minorities make up 50% of Biochemistry & Biophysics doctoral degree recipients at Pennsylvania State University-Main Campus, above the national average of 31%.*
*The racial-ethnic minorities figure is the total number of graduates minus White, international (nonresident), and unknown-race graduates.
More Specific Biochemistry & Biophysics Concentrations at Pennsylvania State University-Main Campus
The Biochemistry & Biophysics program at Pennsylvania State University-Main Campus breaks down into more specific concentrations:
| Concentration | Graduates |
|---|---|
| Biochemistry | 104 |
Highest-Paying Careers for Biochemistry & Biophysics Graduates
Students who finish Biochemistry & Biophysics program at Pennsylvania State University-Main Campus pursue many career paths. Below are the best-paid careers for Biochemistry & Biophysics graduates, ordered by median annual salary:
| Occupation | Nationwide Median Wage |
|---|---|
| Water Resource Specialists | $179,716 |
| Natural Sciences Managers | $132,227 |
| Medical Scientists, Except Epidemiologists | $111,314 |
| Clinical Research Coordinators | $110,931 |
| Biochemists and Biophysicists | $107,979 |
| Food Science Technicians | $100,898 |
| Biological Technicians | $100,160 |
| Molecular and Cellular Biologists | $100,077 |
| Bioinformatics Scientists | $92,484 |
| Biological Scientists, All Other | $79,550 |
References
- IPEDS — Integrated Postsecondary Education Data System
- U.S. Department of Education — College Scorecard
- O*NET Online (Bureau of Labor Statistics)
- National Center for Education Statistics
More about our data sources and methodologies.
Course Advisor provides higher-education, college and university, degree, program, career, salary, and other helpful information to students, faculty, institutions, and other internet audiences. Presented information and data are subject to change. Inclusion on this website does not imply or represent a direct relationship with the company, school, or brand. Information, though believed correct at time of publication, may not be correct, and no warranty is provided. Contact the schools to verify any information before relying on it. Financial aid may be available for those who qualify. The displayed options may include sponsored or recommended results, not necessarily based on your preferences.
© Course Advisor – All Rights Reserved.