Drama & Theater Arts at The Catholic University of America
If you plan to study Drama & Theater Arts, you may want to check out the program at The Catholic University of America. We’ve gathered the following information to help you decide.
The Catholic University of America is located in Washington, DC.
During the most recent reporting year, 18 drama & theater arts degrees were awarded at The Catholic University of America.
Featured schools near , edit
Online & Distance Learning at The Catholic University of America
Online coursework is an option at The Catholic University of America. Of 5,243 students, 459 (9%) studied exclusively online and 667 (13%) took at least some classes online.
Drama & Theater Arts Rankings at The Catholic University of America
Rankings can help you compare The Catholic University of America’s Drama & Theater Arts program against peer institutions.
Bachelor’s-Level Rankings
| Ranking | Scope | Rank |
|---|---|---|
| Best Schools (Quality) | District Of Columbia | #1 of 4 |
| Best Value | District Of Columbia | #1 of 3 |
| Best Schools (Quality) | Middle Atlantic (Region) | #3 of 70 |
| Best Schools (Quality) | Nationwide | #17 of 367 |
| Best Value | Middle Atlantic (Region) | #48 of 68 |
| Best Value | Nationwide | #318 of 365 |
Master’s-Level Rankings
| Ranking | Scope | Rank |
|---|---|---|
| Best Schools (Quality) | District Of Columbia | #1 of 4 |
| Best Value | District Of Columbia | #1 of 3 |
| Best Schools (Quality) | Middle Atlantic (Region) | #3 of 70 |
| Best Schools (Quality) | Nationwide | #17 of 367 |
| Best Value | Middle Atlantic (Region) | #48 of 68 |
| Best Value | Nationwide | #318 of 365 |
Student Demographics & Diversity
Take a look at the composition of Drama & Theater Arts graduates at The Catholic University of America, by degree type.
Program-wide, Drama & Theater Arts graduates at The Catholic University of America are 78% women (14) and 22% men (4).
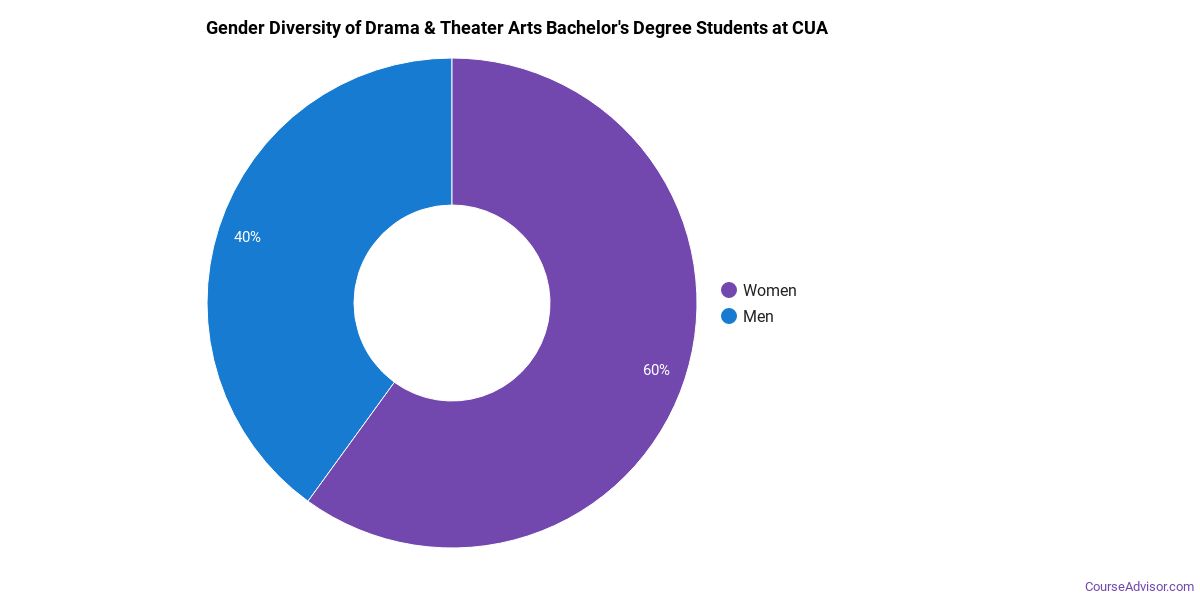
Drama & Theater Arts Bachelor’s Program at The Catholic University of America
Among the 7 bachelor’s drama & theater arts degrees awarded at The Catholic University of America, 57% were women (4) and 43% were men (3).
The following table and chart show the race/ethnicity of Drama & Theater Arts bachelor’s degree recipients at The Catholic University of America.
| Race / Ethnicity | Number of Graduates |
|---|---|
| White | 4 |
| Hispanic / Latino | 2 |
| Two or More Races | 1 |
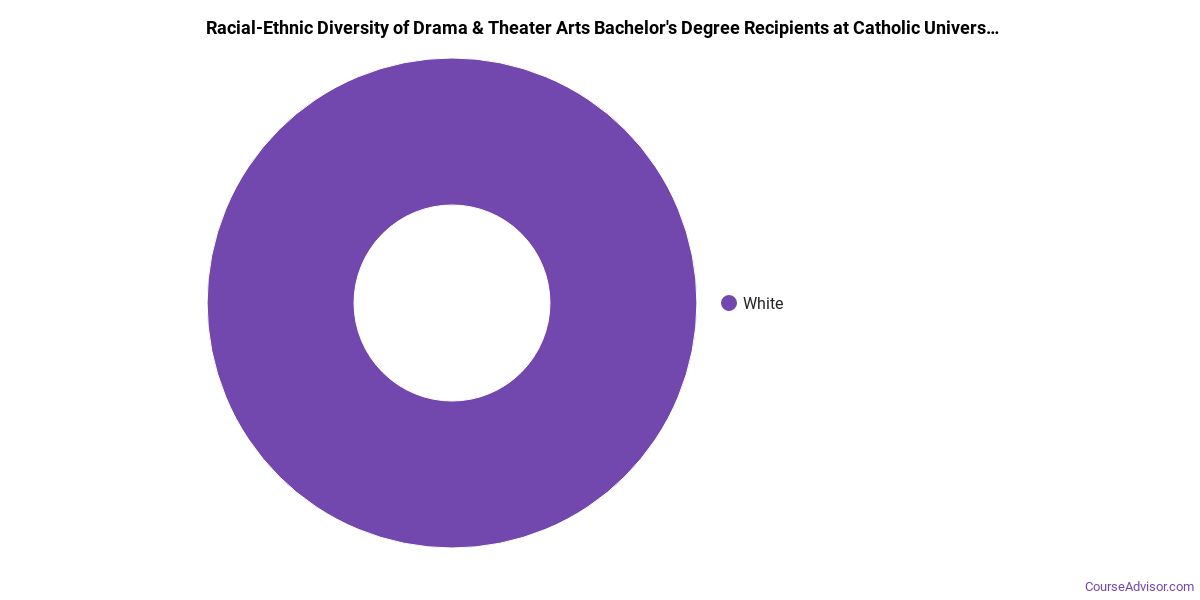
Minority students account for 43% of Drama & Theater Arts bachelor’s degree recipients at The Catholic University of America, higher than the national average of 34%.*
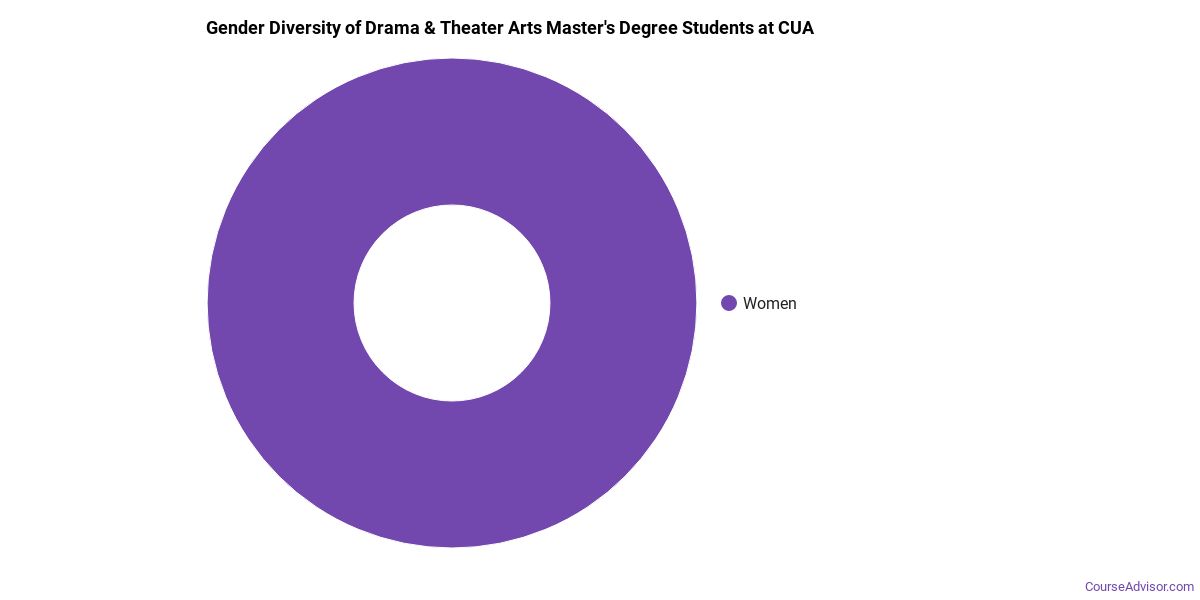
Drama & Theater Arts Master’s Program at The Catholic University of America
Among the 11 master’s drama & theater arts degrees awarded at The Catholic University of America, 91% were women (10) and 9% were men (1).
The following table and chart show the race/ethnicity of Drama & Theater Arts master’s degree recipients at The Catholic University of America.
| Race / Ethnicity | Number of Graduates |
|---|---|
| White | 10 |
| Black / African American | 1 |
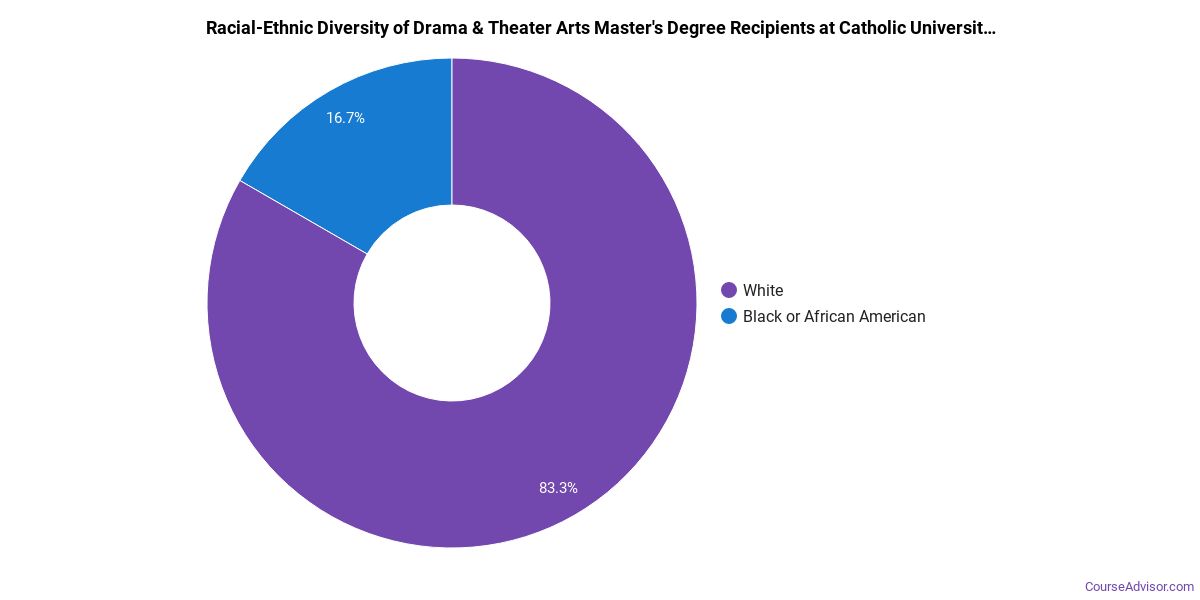
Racial-ethnic minorities make up 9% of Drama & Theater Arts master’s degree recipients at The Catholic University of America, below the national average of 29%.*
*The racial-ethnic minorities figure is the total number of graduates minus White, international (nonresident), and unknown-race graduates.
More Specific Drama & Theater Arts Concentrations at The Catholic University of America
This Drama & Theater Arts program at The Catholic University of America offers more specialized concentrations:
| Concentration | Graduates |
|---|---|
| Theater Arts | 18 |
Top-Paying Careers for Drama & Theater Arts Graduates
Those who complete Drama & Theater Arts program at The Catholic University of America go on to a range of careers. The table below ranks the best-paid careers for Drama & Theater Arts graduates, ordered by median annual salary:
| Occupation | Nationwide Median Wage |
|---|---|
| Choreographers | $109,380 |
| Set and Exhibit Designers | $109,049 |
| Musicians and Singers | $96,571 |
| Media Programming Directors | $90,799 |
| Producers and Directors | $90,515 |
| Dancers | $74,180 |
| Talent Directors | $73,937 |
| Poets, Lyricists and Creative Writers | $70,619 |
| Music Directors and Composers | $66,915 |
| Media Technical Directors/Managers | $65,049 |
References
- IPEDS — Integrated Postsecondary Education Data System
- U.S. Department of Education — College Scorecard
- O*NET Online (Bureau of Labor Statistics)
- National Center for Education Statistics
More about our data sources and methodologies.
Course Advisor provides higher-education, college and university, degree, program, career, salary, and other helpful information to students, faculty, institutions, and other internet audiences. Presented information and data are subject to change. Inclusion on this website does not imply or represent a direct relationship with the company, school, or brand. Information, though believed correct at time of publication, may not be correct, and no warranty is provided. Contact the schools to verify any information before relying on it. Financial aid may be available for those who qualify. The displayed options may include sponsored or recommended results, not necessarily based on your preferences.
© Course Advisor – All Rights Reserved.