Drama & Theater Arts at Bennington College
What traits are you looking for in a school for Drama & Theater Arts, you may want to check out the program at Bennington College. The following information will help you decide if it is a good fit for you.
Bennington College sits in Bennington, VT.
During the most recent reporting year, 19 drama & theater arts degrees were granted at Bennington College.
Featured schools near , edit
Online & Distance Learning at Bennington College
Online coursework is an option at Bennington College. Among 927 students, 132 (14%) were enrolled entirely in distance education and 62 (7%) took at least some classes online.
Drama & Theater Arts Rankings at Bennington College
Rankings can help you compare Bennington College’s Drama & Theater Arts program against peer institutions.
Bachelor’s-Level Rankings
| Ranking | Scope | Rank |
|---|---|---|
| Best Schools (Quality) | Vermont | #1 of 1 |
| Best Value | Vermont | #1 of 1 |
| Best Value | New England (Region) | #16 of 18 |
| Best Schools (Quality) | New England (Region) | #18 of 18 |
| Best Value | Nationwide | #321 of 365 |
| Best Schools (Quality) | Nationwide | #353 of 367 |
Earnings for Drama & Theater Arts Graduates from Bennington College
Those who finish Bennington College’s Drama & Theater Arts program earn at the following median levels (per the U.S. Department of Education’s College Scorecard):
| Years After Graduation | Median Earnings |
|---|---|
| 1 year | $15,302 |
Median Debt at Graduation
Typical debt at graduation for Drama & Theater Arts graduates from Bennington College is $26,445.
Student Demographics & Diversity
Take a look at the diversity of Drama & Theater Arts graduates at Bennington College, by degree type.
Across all degree levels, Drama & Theater Arts graduates at Bennington College are 63% women (12) and 37% men (7).
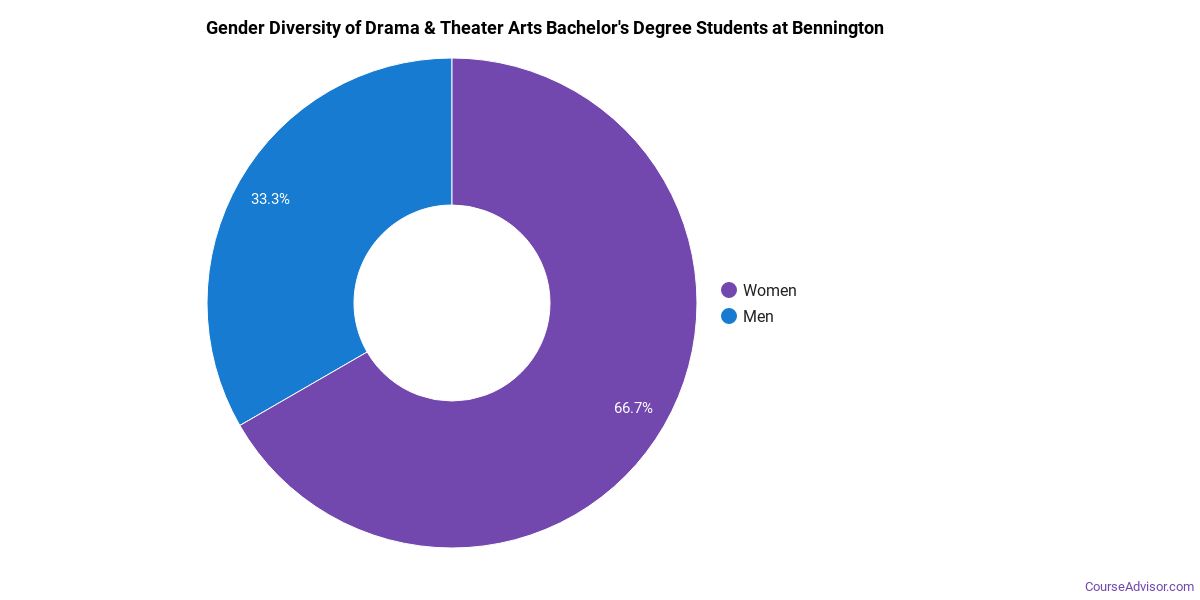
Drama & Theater Arts Bachelor’s Program at Bennington College
Among the 19 bachelor’s drama & theater arts degrees awarded at Bennington College, 63% were women (12) and 37% were men (7).
The following table and chart show the race/ethnicity of Drama & Theater Arts bachelor’s degree recipients at Bennington College.
| Race / Ethnicity | Number of Graduates |
|---|---|
| White | 16 |
| International (Nonresident) | 3 |
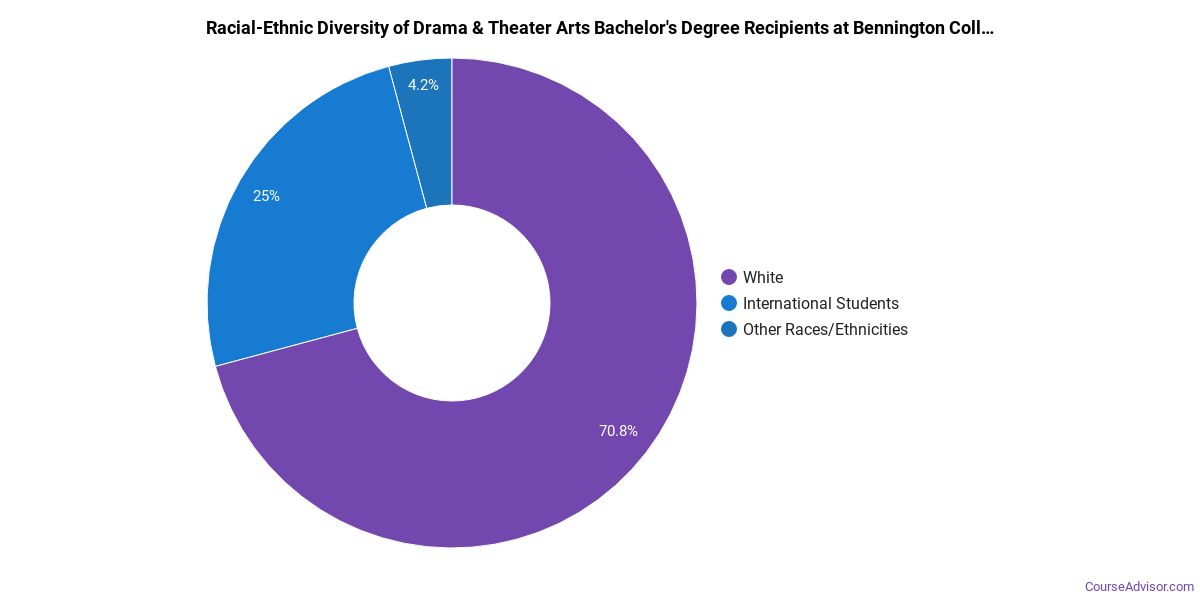
*The racial-ethnic minorities figure is the total number of graduates minus White, international (nonresident), and unknown-race graduates.
More Specific Drama & Theater Arts Concentrations at Bennington College
The Drama & Theater Arts program at Bennington College offers more specialized concentrations:
| Concentration | Graduates |
|---|---|
| Theater Arts | 17 |
| Theater Design & Technology | 1 |
| Costume Design | 1 |
Top-Paying Careers for Drama & Theater Arts Graduates
Graduates of the Drama & Theater Arts program at Bennington College work across a variety of fields. Below are the top-paying careers for Drama & Theater Arts majors, ordered by median annual salary:
| Occupation | Nationwide Median Wage |
|---|---|
| Choreographers | $109,380 |
| Set and Exhibit Designers | $109,049 |
| Musicians and Singers | $96,571 |
| Media Programming Directors | $90,799 |
| Producers and Directors | $90,515 |
| Dancers | $74,180 |
| Talent Directors | $73,937 |
| Poets, Lyricists and Creative Writers | $70,619 |
| Music Directors and Composers | $66,915 |
| Media Technical Directors/Managers | $65,049 |
References
- IPEDS — Integrated Postsecondary Education Data System
- U.S. Department of Education — College Scorecard
- O*NET Online (Bureau of Labor Statistics)
- National Center for Education Statistics
More about our data sources and methodologies.
Course Advisor provides higher-education, college and university, degree, program, career, salary, and other helpful information to students, faculty, institutions, and other internet audiences. Presented information and data are subject to change. Inclusion on this website does not imply or represent a direct relationship with the company, school, or brand. Information, though believed correct at time of publication, may not be correct, and no warranty is provided. Contact the schools to verify any information before relying on it. Financial aid may be available for those who qualify. The displayed options may include sponsored or recommended results, not necessarily based on your preferences.
© Course Advisor – All Rights Reserved.