Customer Service Representatives in Ohio
Considering working as a Customer Service Representatives in Ohio? Here’s what the data says. Interact with customers to provide basic or scripted information in response to routine inquiries about products and services. May handle and resolve general complaints. Excludes individuals whose duties are primarily installation, sales, repair, and technical support.
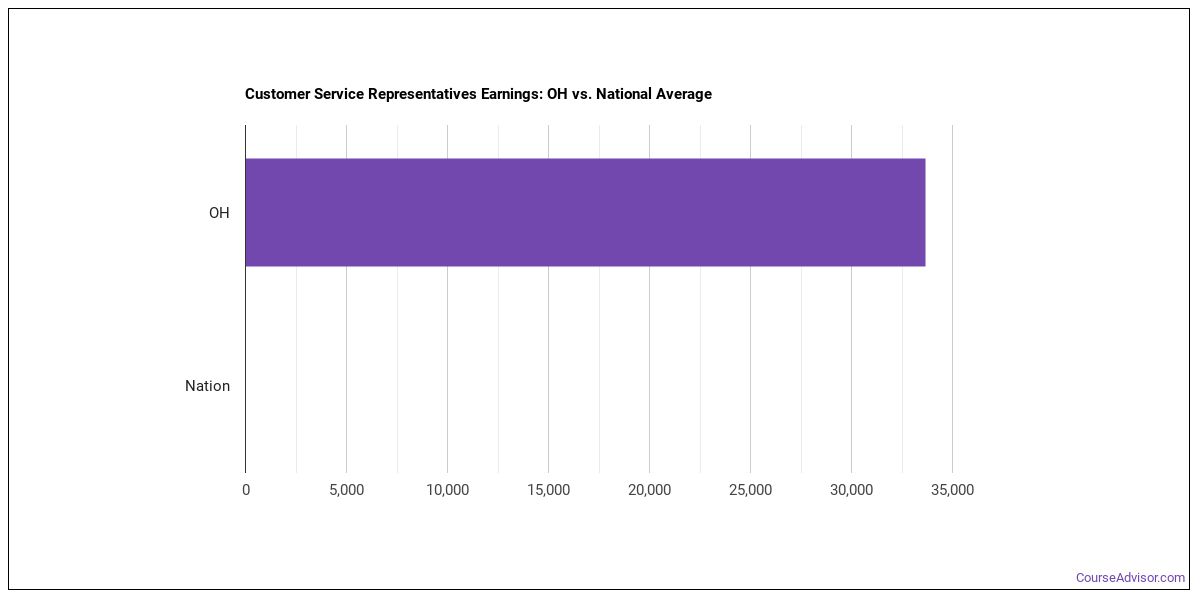
What do Customer Service Representatives Make in Ohio?
For a customer service representatives working in Ohio, the median annual wage is $43,510 per year (or about $20.92/hour).Earnings range from $30,520 at the 10th percentile to $60,790 at the 90th percentile.
| Wage Statistic | Annual | Hourly |
|---|---|---|
| 10th percentile | $30,520 | $14.67 |
| 25th percentile | $36,360 | $17.48 |
| Median (50th) | $43,510 | $20.92 |
| 75th percentile | $48,960 | $23.54 |
| 90th percentile | $60,790 | $29.23 |

The job concentration index in Ohio nationwide is 0.93.
National Wage Comparison
Nationally, customer service representatives earn a median of $62,906 per year ($30.24/hour), below the Ohio median.
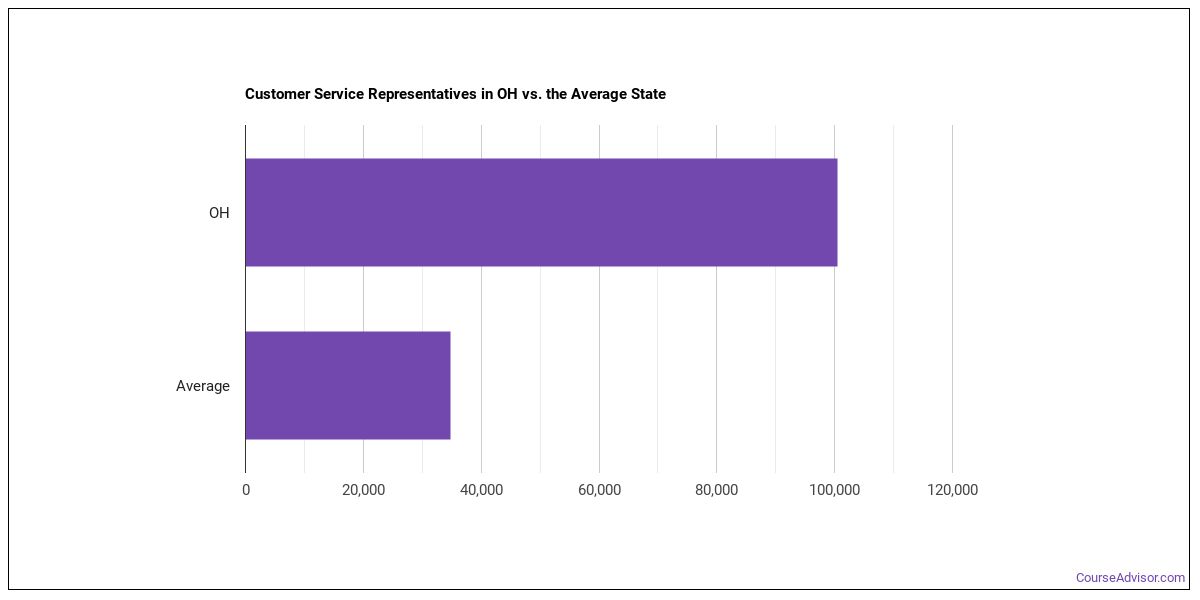
Employment Outlook
There are roughly 1,970,663 customer service representatives across the United States. In Ohio alone, around 90,710 people work in this role. That’s more than the typical state, which employs around 33,380 customer service representatives.

Top Ohio Metros for Customer Service Representatives
The largest metro-area employers of customer service representatives in Ohio.
| Metro Area | Number Employed | Annual Median Salary |
|---|---|---|
| Columbus, OH | 22,100 | $45,760 |
| Cincinnati, OH-KY-IN | 20,590 | $40,700 |
| Cleveland, OH | 15,780 | $43,960 |
| Dayton-Kettering-Beavercreek, OH | 5,610 | $44,890 |
| Akron, OH | 5,160 | $43,260 |
| Toledo, OH | 3,340 | $41,360 |
| Canton-Massillon, OH | 2,710 | $38,850 |
| Youngstown-Warren, OH | 1,940 | $37,670 |
| Springfield, OH | 920 | $37,160 |
| Mansfield, OH | 600 | $36,330 |
| Sandusky, OH | 530 | $36,970 |
| Lima, OH | 520 | $37,540 |
Top States for Customer Service Representatives Employment
View the states that employ the most customer service representatives work.
| State | Number Employed |
|---|---|
| Texas | 330,540 |
| Florida | 238,300 |
| California | 183,350 |
| New York | 145,100 |
| Georgia | 112,790 |
| Illinois | 109,940 |
| Pennsylvania | 102,100 |
| North Carolina | 91,980 |
| Ohio | 90,710 |
| Arizona | 89,030 |
| Michigan | 69,830 |
| New Jersey | 64,950 |
| Tennessee | 64,880 |
| Virginia | 62,280 |
| Minnesota | 59,170 |
| Missouri | 56,190 |
| Wisconsin | 55,100 |
| Massachusetts | 54,660 |
| South Carolina | 52,840 |
| Utah | 48,770 |
Highest-Paying States for Customer Service Representatives
The highest-paying states for customer service representatives.
| State | Annual Median Salary |
|---|---|
| District of Columbia | $49,210 |
| Washington | $49,150 |
| Massachusetts | $48,060 |
| New York | $47,840 |
| California | $47,790 |
| Minnesota | $47,470 |
| Connecticut | $47,260 |
| New Hampshire | $46,960 |
| New Jersey | $46,740 |
| Rhode Island | $46,490 |
Skills
The most important customer service representatives skills, rated on an importance scale of 0 to 5:
Knowledge Areas
Core knowledge areas for this occupation, rated on an importance scale of 0 to 5:
Abilities
The abilities that matter most for customer service representatives, rated on an importance scale of 0 to 5:
Daily Tasks
Day-to-day, customer service representatives typically:
- Confer with customers by telephone or in person to provide information about products or services, take or enter orders, cancel accounts, or obtain details of complaints.
- Keep records of customer interactions or transactions, recording details of inquiries, complaints, or comments, as well as actions taken.
- Check to ensure that appropriate changes were made to resolve customers' problems.
- Contact customers to respond to inquiries or to notify them of claim investigation results or any planned adjustments.
- Determine charges for services requested, collect deposits or payments, or arrange for billing.
- Complete contract forms, prepare change of address records, or issue service discontinuance orders, using computers.
- Refer unresolved customer grievances to designated departments for further investigation.
- Resolve customers' service or billing complaints by performing activities such as exchanging merchandise, refunding money, or adjusting bills.
- Review insurance policy terms to determine whether a particular loss is covered by insurance.
- Solicit sales of new or additional services or products.
- Compare disputed merchandise with original requisitions and information from invoices and prepare invoices for returned goods.
- Obtain and examine all relevant information to assess validity of complaints and to determine possible causes, such as extreme weather conditions that could increase utility bills.
Work Activities
- Communicating with Supervisors, Peers, or Subordinates
- Working with Computers
- Communicating with People Outside the Organization
- Performing for or Working Directly with the Public
- Processing Information
- Getting Information
- Updating and Using Relevant Knowledge
- Organizing, Planning, and Prioritizing Work
- Training and Teaching Others
- Resolving Conflicts and Negotiating with Others
- Making Decisions and Solving Problems
- Performing Administrative Activities
Tools & Technology
Common tools and software used in this occupation include: Hot technologies: Adobe Acrobat, Adobe Creative Cloud software, Adobe Illustrator, Adobe Photoshop In-demand technologies: Microsoft Excel
What Major Will Prepare You For This Career?
Programs that train for this career include:
- Business Support & Assistance
Featured schools near , edit
Related Careers
Other careers like customer service representatives include:
- Management Analysts
- First-Line Supervisors of Non-Retail Sales Workers
- Cashiers
- Counter and Rental Clerks
- Insurance Sales Agents
- Sales Representatives of Services, Except Advertising, Insurance, Financial Services, and Travel
Also Known As
Account Adjuster, Account Representative, Adjustment Clerk, Automotive Service Advisor, Automotive Service Writer, Bill Adjuster, Call Center Representative, Claims Customer Service Representative (Claims CSR), Clerical Adjudicator, Client Relations Specialist, Client Service Representative (Client Service Rep), Client Services Representative, Client Support Professional, Compensation Adjuster, Complaints Adjuster.
References
- U.S. Bureau of Labor Statistics, Occupational Employment and Wage Statistics — https://www.bls.gov/oes/
- O*NET Online — https://www.onetonline.org/
- BLS Employment Projections — https://www.bls.gov/emp/
- O*NET-SOC code: 43-4051.00
Course Advisor provides higher-education, college and university, degree, program, career, salary, and other helpful information to students, faculty, institutions, and other internet audiences. Presented information and data are subject to change. Inclusion on this website does not imply or represent a direct relationship with the company, school, or brand. Information, though believed correct at time of publication, may not be correct, and no warranty is provided. Contact the schools to verify any information before relying on it. Financial aid may be available for those who qualify. The displayed options may include sponsored or recommended results, not necessarily based on your preferences.
© Course Advisor – All Rights Reserved.