Visual & Performing Arts Undergraduate Certificates
There are 2,079 schools in the United States where you can earn aundergraduate certificate in Visual & Performing Arts. This degree is more popular with female students, and about54% were students from underrepresented racial-ethnic groups. Also, 5.1% of Visual & Performing Arts graduates were international students.
Featured schools near , edit
Education Levels of Visual & Performing Arts Majors
In the most recent reporting year, 153,937 students earned theirVisual & Performing Arts majors across all award levels. The following table shows the number of diplomas awarded in Visual & Performing Arts at each degree level.
| Education Level | Number of Grads |
|---|---|
| Certificate (this page) | 8,919 |
| Associate’s Degree | 21,054 |
| Bachelor’s Degree | 95,619 |
| Master’s Degree | 25,861 |
| Doctor’s Degree | 1,908 |

Earnings of Visual & Performing Arts Majors With Undergraduate Certificates (All Award Levels)
Federal data tracks the median salary for graduates with aundergraduate certificate in Visual & Performing Arts of $37,283 four years after graduation. These figures are reported program-wide, across all award levels.
A lot of factors can contribute to this number, such as the location of your workplace and the availability of other perks and bonuses.
| Years After Graduation | Median Earnings |
|---|---|
| 1 year | $27,422 |
| 4 years | $37,283 |
| 5 years | $42,578 |
Source: U.S. Department of Education College Scorecard, field-of-study earnings tracker (program-wide, all award levels).
Student Debt (All Award Levels)
The data on debt ranges for Visual & Performing Arts majors who have their undergraduate certificate is not currently available.
Student Diversity
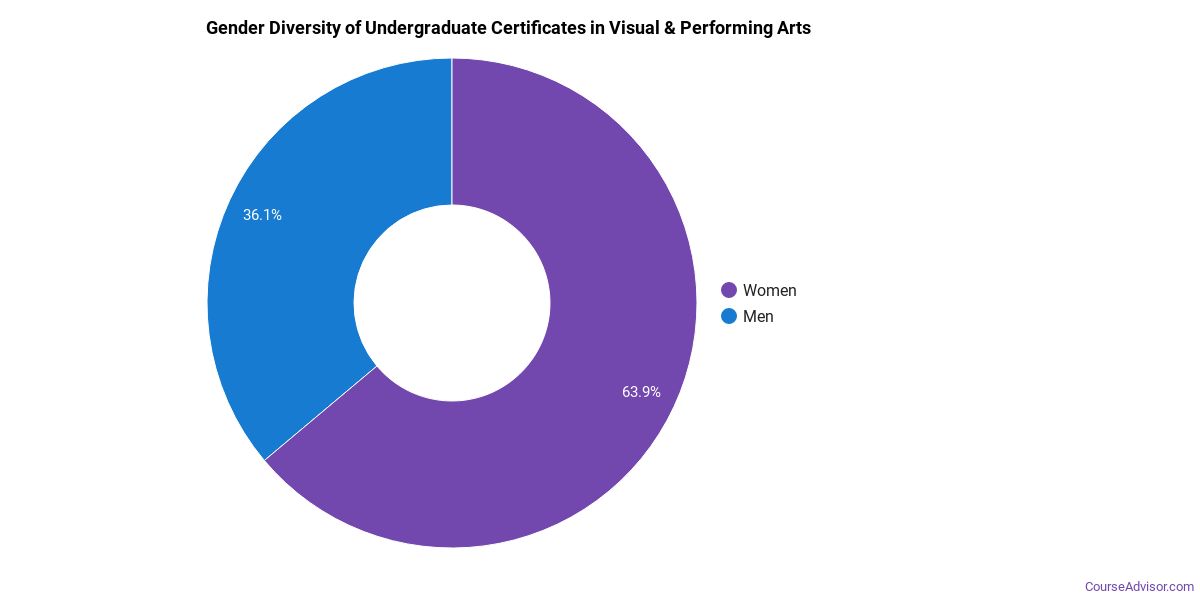
This degree is more popular with female students. About 61.7% of graduates with this degree are women.
| Gender | Number of Grads |
|---|---|
| Men | 3,414 |
| Women | 5,505 |
The racial-ethnic distribution of Visual & Performing Arts graduates is as follows:
| Race / Ethnicity | Number of Grads | Share |
|---|---|---|
| White | 3,629 | 40.7% |
| Asian | 325 | 3.6% |
| Hispanic or Latino | 2,976 | 33.4% |
| Black or African American | 732 | 8.2% |
| American Indian / Alaska Native | 134 | 1.5% |
| Native Hawaiian / Pacific Islander | 19 | 0.2% |
| Two or More Races | 413 | 4.6% |
| Race Unknown | 235 | 2.6% |
| International Students | 456 | 5.1% |
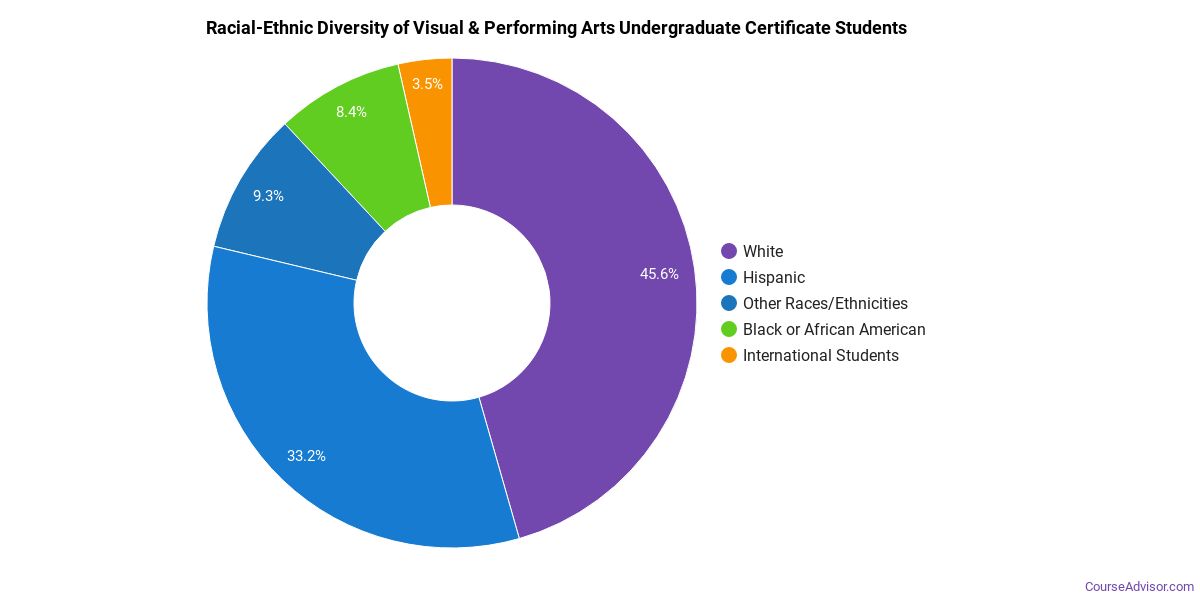
This degree is moderately popular with international students. Around 5.1% of graduates are in this category.
See the minority definition in the References below.
Most Popular Visual & Performing Arts Programs for Undergraduate Certificates
There are 2,217 colleges that offer a undergraduate certificate in Visual & Performing Arts. Learn more about the most popular below:

Full Sail University tops the list of the most popular schools in the U.S. for Visual & Performing Arts majors seeking their undergraduate certificate. This school awarded 2,710 undergraduate certificates in Visual & Performing Arts in the most recent reporting year. Data shows that graduates who hold this degree go on to make a median salary of $40,669.
New York University comes in at #2 on our list of the most popular colleges offering undergraduate certificates in Visual & Performing Arts. During the most recent year for which we have data, 1,990 people received their undergraduate certificate in Visual & Performing Arts from this school. Data shows that graduates who hold this degree go on to make a median salary of $40,669.
Fashion Institute of Technology is a popular choice for Visual & Performing Arts majors seeking their undergraduate certificate. This school awarded 1,578 undergraduate certificates in Visual & Performing Arts in the most recent reporting year. Data shows that graduates who hold this degree go on to make a median salary of $40,669.
Savannah College of Art and Design comes in at #4 on our list of the most popular colleges offering undergraduate certificates in Visual & Performing Arts. This school awarded 1,523 undergraduate certificates in Visual & Performing Arts in the most recent reporting year. Graduates who complete their undergraduate certificate in Visual & Performing Arts here go on to a median salary of $40,669.
The New School comes in at #5 on our list of the most popular colleges offering undergraduate certificates in Visual & Performing Arts. During the most recent year for which we have data, 1,434 people received their undergraduate certificate in Visual & Performing Arts from this school. Graduates who complete their undergraduate certificate in Visual & Performing Arts here go on to a median salary of $40,669.
Berklee College of Music is a popular choice for Visual & Performing Arts majors seeking their undergraduate certificate. During the most recent year for which we have data, 1,269 people received their undergraduate certificate in Visual & Performing Arts from this school. Graduates who complete their undergraduate certificate in Visual & Performing Arts here go on to a median salary of $40,669.
University of Central Florida comes in at #7 on our list of the most popular colleges offering undergraduate certificates in Visual & Performing Arts. This school awarded 1,175 undergraduate certificates in Visual & Performing Arts in the most recent reporting year. Data shows that graduates who hold this degree go on to make a median salary of $40,669.
Los Angeles Film School is a popular choice for Visual & Performing Arts majors seeking their undergraduate certificate. During the most recent year for which we have data, 1,164 people received their undergraduate certificate in Visual & Performing Arts from this school. Graduates who complete their undergraduate certificate in Visual & Performing Arts here go on to a median salary of $40,669.
University of Southern California comes in at #9 on our list of the most popular colleges offering undergraduate certificates in Visual & Performing Arts. This school awarded 1,163 undergraduate certificates in Visual & Performing Arts in the most recent reporting year. Graduates who complete their undergraduate certificate in Visual & Performing Arts here go on to a median salary of $40,669.
Southern New Hampshire University is a popular choice for Visual & Performing Arts majors seeking their undergraduate certificate. This school awarded 1,090 undergraduate certificates in Visual & Performing Arts in the most recent reporting year. Graduates who complete their undergraduate certificate in Visual & Performing Arts here go on to a median salary of $40,669.
Mesa Community College comes in at #11 on our list of the most popular colleges offering undergraduate certificates in Visual & Performing Arts. This school awarded 1,073 undergraduate certificates in Visual & Performing Arts in the most recent reporting year. Graduates who complete their undergraduate certificate in Visual & Performing Arts here go on to a median salary of $40,669.
California State University-Long Beach is a popular choice for Visual & Performing Arts majors seeking their undergraduate certificate. This school awarded 1,005 undergraduate certificates in Visual & Performing Arts in the most recent reporting year. Data shows that graduates who hold this degree go on to make a median salary of $40,669.
Columbia College Chicago is a popular choice for Visual & Performing Arts majors seeking their undergraduate certificate. This school awarded 989 undergraduate certificates in Visual & Performing Arts in the most recent reporting year. Graduates who complete their undergraduate certificate in Visual & Performing Arts here go on to a median salary of $40,669.
School of the Art Institute of Chicago is a popular choice for Visual & Performing Arts majors seeking their undergraduate certificate. This school awarded 958 undergraduate certificates in Visual & Performing Arts in the most recent reporting year. Data shows that graduates who hold this degree go on to make a median salary of $40,669.
Arizona State University Campus Immersion is a popular choice for Visual & Performing Arts majors seeking their undergraduate certificate. During the most recent year for which we have data, 896 people received their undergraduate certificate in Visual & Performing Arts from this school. Graduates who complete their undergraduate certificate in Visual & Performing Arts here go on to a median salary of $40,669.
University of North Texas is a popular choice for Visual & Performing Arts majors seeking their undergraduate certificate. During the most recent year for which we have data, 852 people received their undergraduate certificate in Visual & Performing Arts from this school. Graduates who complete their undergraduate certificate in Visual & Performing Arts here go on to a median salary of $40,669.
Pratt Institute-Main comes in at #17 on our list of the most popular colleges offering undergraduate certificates in Visual & Performing Arts. During the most recent year for which we have data, 756 people received their undergraduate certificate in Visual & Performing Arts from this school. Data shows that graduates who hold this degree go on to make a median salary of $40,669.
Utah Valley University is a popular choice for Visual & Performing Arts majors seeking their undergraduate certificate. This school awarded 750 undergraduate certificates in Visual & Performing Arts in the most recent reporting year. Graduates who complete their undergraduate certificate in Visual & Performing Arts here go on to a median salary of $40,669.
Belmont University comes in at #19 on our list of the most popular colleges offering undergraduate certificates in Visual & Performing Arts. During the most recent year for which we have data, 727 people received their undergraduate certificate in Visual & Performing Arts from this school. Graduates who complete their undergraduate certificate in Visual & Performing Arts here go on to a median salary of $40,669.
Indiana University-Bloomington is a popular choice for Visual & Performing Arts majors seeking their undergraduate certificate. During the most recent year for which we have data, 720 people received their undergraduate certificate in Visual & Performing Arts from this school. Graduates who complete their undergraduate certificate in Visual & Performing Arts here go on to a median salary of $40,669.
Visual & Performing Arts Focus Areas
| Major | Annual Degrees Awarded |
|---|---|
| Design and Applied Arts | 38,798 |
| Fine and Studio Arts | 37,770 |
| Music | 25,853 |
| Film/Video and Photographic Arts | 18,927 |
| Drama/Theatre Arts and Stagecraft | 16,640 |
Explore Visual & Performing Arts by State
Alabama
California
District of Columbia
Idaho
Kansas
Maryland
Mississippi
Nevada
New York
Oklahoma
South Carolina
Utah
West Virginia
Alaska
Colorado
Florida
Illinois
Kentucky
Massachusetts
Missouri
New Hampshire
North Carolina
Oregon
South Dakota
Vermont
Wisconsin
References
The racial-ethnic minority student count is calculated by taking the total number of students and subtracting white students, international students, and students whose race/ethnicity was unknown. This number is then divided by the total number of students to obtain the percentage of racial-ethnic minorities.
- College Factual
- National Center for Education Statistics (IPEDS)
- O*NET Online
- U.S. Bureau of Labor Statistics
- U.S. Department of Education College Scorecard
More about our data sources and methodologies.
Course Advisor provides higher-education, college and university, degree, program, career, salary, and other helpful information to students, faculty, institutions, and other internet audiences. Presented information and data are subject to change. Inclusion on this website does not imply or represent a direct relationship with the company, school, or brand. Information, though believed correct at time of publication, may not be correct, and no warranty is provided. Contact the schools to verify any information before relying on it. Financial aid may be available for those who qualify. The displayed options may include sponsored or recommended results, not necessarily based on your preferences.
© Course Advisor – All Rights Reserved.