Arizona State University Campus Immersion Science & Tech Programs
Arizona State University Campus Immersion is a public institution located in Tempe, AZ. A Mid-Sized City offers tranquility and safety near the excitement of urban amenities.
Featured schools near , edit
Arizona State University Campus Immersion Rankings
ASU Tempe appears in the following rankings for science & tech programs at the bachelors level:
| Ranking | Rank | Among |
|---|---|---|
| Overall Quality | #1 of 82 | State — Arizona |
| Overall Quality | #9 of 484 | Region — Southwest |
| Overall Quality | #134 of 4,630 | Nationwide |
Where Is Arizona State University Campus Immersion?
Contact information for ASU Tempe are listed below.
| Contact Details | |
|---|---|
| Address: | University Drive and Mill Avenue, Tempe, AZ 85287 |
| Phone: | 8552785080 |
| Website: | www.asu.edu/ |
| Admissions: | admission.asu.edu/contact |
| Financial Aid: | students.asu.edu/contact/financialaid |
How Do I Get Into ASU Tempe?
You can apply to ASU Tempe online at: https://webapp4.asu.edu/uga_admissionsapp/
ASU Tempe is classified as Least Selective (85%+) for admissions.
Admission Requirements for ASU Tempe
This is what ASU Tempe considers when reviewing applications:
| Requirement | Status |
|---|---|
| Secondary School Record | Required |
| Secondary School GPA | Considered but not required |
| Recommendations | Neither required nor recommended |
| Admission Test Scores (SAT/ACT) | Neither required nor recommended |
How Hard Is It To Get Into ASU Tempe?
ASU Tempe admits 90%, which makes it highly accessible. Ensure you meet all application requirements and prepare the application in full.
Of those admitted, 22% choose to enroll — a typical enrollment-to-admission yield.
Average Test Scores
Selectivity by Gender
Selectivity numbers at ASU Tempe can differ by gender.
| Gender | Applicants | Admitted | Acceptance Rate |
|---|---|---|---|
| Men | 34,345 | 30,552 | 89% |
| Women | 36,574 | 33,196 | 91% |
Can I Afford Arizona State University Campus Immersion?
The average net price after aid at ASU Tempe is $13,670. The affordability of the school largely depends on your financial need since net price varies by income group.
Tuition & Fees
| Category | Cost |
|---|---|
| In-State Tuition | $11,478 |
| In-State Fees | $745 |
| Out-of-State Tuition | $32,394 |
| Out-of-State Fees | $745 |
| Total In-State Tuition & Fees | $12,223 |
| Total Out-of-State Tuition & Fees | $33,139 |
Financial Aid
Counting all forms of financial assistance, 21% of students at ASU Tempe receive some form of financial aid (13,987 students).
Nearly 77% of students at ASU Tempe receive grant or scholarship aid, averaging $12,676 per student.
29% of students receive federal Pell Grants, averaging $5,858.
Student Loan Debt
27% of ASU Tempe undergraduates take out federal student loans, averaging $6,625 per year.
Arizona State University Campus Immersion Undergraduate Student Diversity
There are 16,508 students enrolled at ASU Tempe. ASU Tempe is classified as a 20,000 and above institution by enrollment size. Its Carnegie Classification is Doctoral Universities: Highest Research Activity.
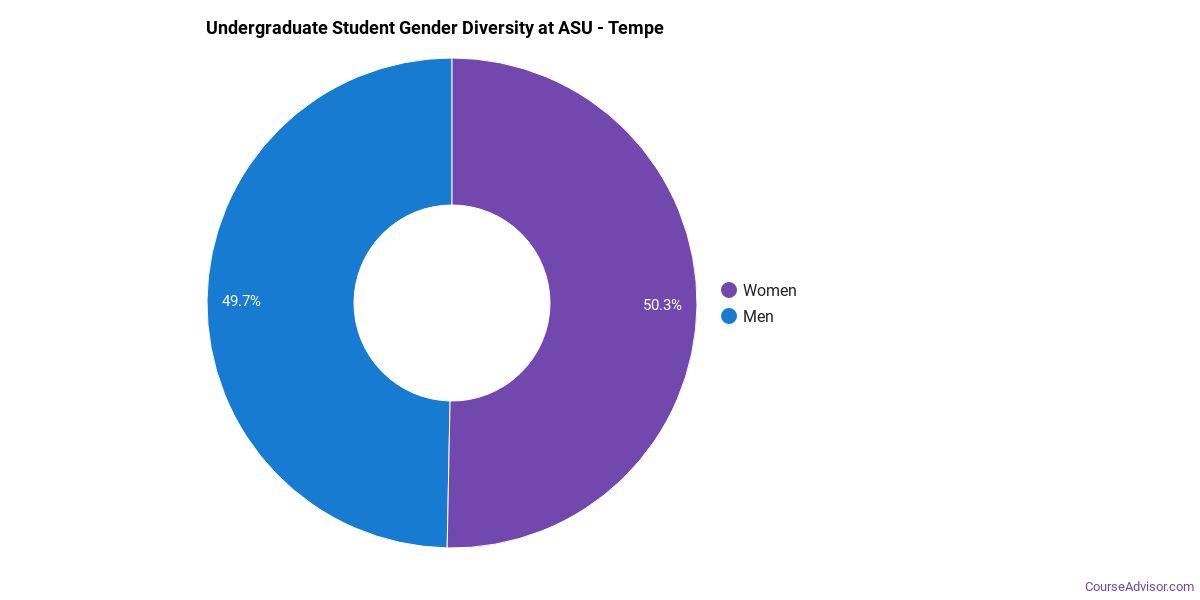
Gender Diversity
Of the 64,398 undergraduate students at ASU Tempe, approximately 51% are male and 49% are female.
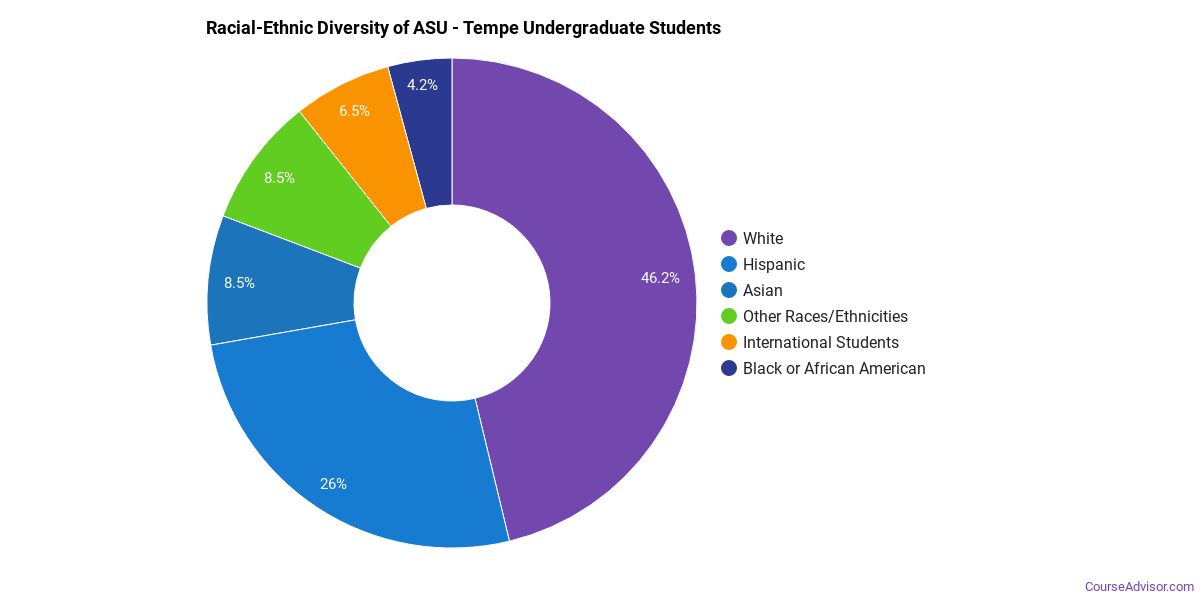
Racial-Ethnic Diversity
The racial-ethnic breakdown of Arizona State University Campus Immersion undergraduate students is as follows.
| Race/Ethnicity | Number of Students |
|---|---|
| Asian | 5,989 |
| Black or African American | 2,833 |
| Hispanic | 17,129 |
| White | 26,274 |
| American Indian/Alaska Native | 708 |
| Native Hawaiian/Pacific Islander | 128 |
| Two or More Races | 3,284 |
| Non-Resident | 5,216 |
Geographic Diversity
The top 5 home states of first-time undergraduate students at ASU Tempe are shown below.

| State | First-Time UG Students |
|---|---|
| Arizona | 8,909 |
| California | 1,168 |
| Texas | 336 |
| Washington | 294 |
| Illinois | 267 |
Additionally, approximately 8.1% of undergraduate students are non-resident from outside the United States.
Arizona State University Campus Immersion Graduate Student Diversity
14,419 of ASU Tempe’s students are in graduate programs. The highest graduate-level award offered is Doctor’s degree.
Gender Diversity (Graduate)
Among graduate students at ASU Tempe, approximately 56% are male and 44% are female.

Racial-Ethnic Diversity (Graduate)
The racial-ethnic breakdown of Arizona State University Campus Immersion graduate students is as follows.

| Race/Ethnicity | Number of Students |
|---|---|
| Asian | 764 |
| Black or African American | 346 |
| Hispanic | 1,384 |
| White | 3,734 |
| American Indian/Alaska Native | 115 |
| Native Hawaiian/Pacific Islander | 28 |
| Two or More Races | 360 |
| Non-Resident | 7,310 |
Online Learning at Arizona State University Campus Immersion
ASU Tempe delivers remote learning paths for students who need flexibility.
40,316 undergraduate students at ASU Tempe took at least one online class — of those, 3,384 took all of their classes online.
At the graduate level, 2,093 students took at least one online class and 453 took all classes online. Distance education is available at the undergraduate and graduate levels.
Science & Tech Programs at Arizona State University Campus Immersion
These science & tech degree programs are offered by ASU Tempe, with per-level degree counts in the most recent reporting year.
| Program | Bachelor’s | Master’s | Doctorate | Total |
|---|---|---|---|---|
| Architecture | 162 | — | 6 | 168 |
| Architectural Sciences and Technology | — | 72 | — | 72 |
| City/Urban, Community, and Regional Planning | 39 | 20 | — | 59 |
| Real Estate Development | — | 31 | — | 31 |
| Environmental Design | 20 | 2 | — | 22 |
| Landscape Architecture | 13 | 9 | — | 22 |
| Interior Architecture | — | 14 | — | 14 |
Academic Programs at Arizona State University Campus Immersion
ASU Tempe offers 32 distinct academic programs.
The highest level of award offered is Doctor’s degree.
Institutional Profile
ASU Tempe maintains an open admission policy: No. Credit transfer:
- AP credits: Implied no
- Dual enrollment credits: Yes
- Life experience credits: Implied no
References
More about our data sources and methodologies.
Course Advisor provides higher-education, college and university, degree, program, career, salary, and other helpful information to students, faculty, institutions, and other internet audiences. Presented information and data are subject to change. Inclusion on this website does not imply or represent a direct relationship with the company, school, or brand. Information, though believed correct at time of publication, may not be correct, and no warranty is provided. Contact the schools to verify any information before relying on it. Financial aid may be available for those who qualify. The displayed options may include sponsored or recommended results, not necessarily based on your preferences.
© Course Advisor – All Rights Reserved.