The New School Science & Tech Programs
The New School is a private not-for-profit institution located in New York, NY. A Major City Center offers an ideal setting near the excitement of urban amenities.
Featured schools near , edit
The New School Rankings
New School University; Parsons The New School for Design; New School for Social Research; Eugene Lang College; Mannes College; The New School for Drama; The New School for Jazz and Contemporary Music; The New School for Public Engagement is featured in these rankings for science & tech programs at the bachelors level:
| Ranking | Rank | Among |
|---|---|---|
| Overall Quality | #62 of 291 | State — New York |
| Overall Quality | #158 of 758 | Region — Middle Atlantic |
| Overall Quality | #701 of 4,630 | Nationwide |
Where Is The New School?
Contact details for New School University; Parsons The New School for Design; New School for Social Research; Eugene Lang College; Mannes College; The New School for Drama; The New School for Jazz and Contemporary Music; The New School for Public Engagement are given below.
| Contact Details | |
|---|---|
| Phone: | 2122295600 |
| Website: | www.newschool.edu/ |
| Admissions: | www.newschool.edu/admission/ |
| Financial Aid: | www.newschool.edu/admission/financial-aid/ |
How Do I Get Into New School University; Parsons The New School for Design; New School for Social Research; Eugene Lang College; Mannes College; The New School for Drama; The New School for Jazz and Contemporary Music; The New School for Public Engagement?
You can apply to New School University; Parsons The New School for Design; New School for Social Research; Eugene Lang College; Mannes College; The New School for Drama; The New School for Jazz and Contemporary Music; The New School for Public Engagement online at: https://www.newschool.edu/apply/
New School University; Parsons The New School for Design; New School for Social Research; Eugene Lang College; Mannes College; The New School for Drama; The New School for Jazz and Contemporary Music; The New School for Public Engagement is classified as Moderately Selective (50-70%) for admissions.
Admission Requirements for New School University; Parsons The New School for Design; New School for Social Research; Eugene Lang College; Mannes College; The New School for Drama; The New School for Jazz and Contemporary Music; The New School for Public Engagement
This is what New School University; Parsons The New School for Design; New School for Social Research; Eugene Lang College; Mannes College; The New School for Drama; The New School for Jazz and Contemporary Music; The New School for Public Engagement requires for admission:
| Requirement | Status |
|---|---|
| Secondary School Record | Required |
| Secondary School GPA | Required |
| Recommendations | Required |
| Admission Test Scores (SAT/ACT) | Neither required nor recommended |
How Hard Is It To Get Into New School University; Parsons The New School for Design; New School for Social Research; Eugene Lang College; Mannes College; The New School for Drama; The New School for Jazz and Contemporary Music; The New School for Public Engagement?
New School University; Parsons The New School for Design; New School for Social Research; Eugene Lang College; Mannes College; The New School for Drama; The New School for Jazz and Contemporary Music; The New School for Public Engagement admits 64%, which makes it fairly accessible. Ensure you meet all application requirements and prepare the application in full.
Of those admitted, 21% choose to enroll — a typical enrollment-to-admission yield.
Average Test Scores
Selectivity by Gender
Acceptance rates at New School University; Parsons The New School for Design; New School for Social Research; Eugene Lang College; Mannes College; The New School for Drama; The New School for Jazz and Contemporary Music; The New School for Public Engagement are broken out by gender below.
| Gender | Applicants | Admitted | Acceptance Rate |
|---|---|---|---|
| Men | 2,315 | 1,410 | 61% |
| Women | 6,968 | 4,485 | 64% |
Can I Afford The New School?
The average net price after aid at New School University; Parsons The New School for Design; New School for Social Research; Eugene Lang College; Mannes College; The New School for Drama; The New School for Jazz and Contemporary Music; The New School for Public Engagement is $55,359. Your actual cost will depend on your family’s circumstances since net price varies by income group.
Tuition & Fees
| Category | Cost |
|---|---|
| In-State Tuition | $57,374 |
| In-State Fees | $1,356 |
| Out-of-State Tuition | $57,374 |
| Out-of-State Fees | $1,356 |
| Total In-State Tuition & Fees | $58,730 |
| Total Out-of-State Tuition & Fees | $58,730 |
Financial Aid
Across all aid types, 21% of students at New School University; Parsons The New School for Design; New School for Social Research; Eugene Lang College; Mannes College; The New School for Drama; The New School for Jazz and Contemporary Music; The New School for Public Engagement receive some form of financial aid (1,430 students).
About 97% of students at New School University; Parsons The New School for Design; New School for Social Research; Eugene Lang College; Mannes College; The New School for Drama; The New School for Jazz and Contemporary Music; The New School for Public Engagement receive grant or scholarship aid, averaging $19,395 per student.
15% of students receive federal Pell Grants, averaging $5,701.
Student Loan Debt
25% of New School University; Parsons The New School for Design; New School for Social Research; Eugene Lang College; Mannes College; The New School for Drama; The New School for Jazz and Contemporary Music; The New School for Public Engagement undergraduates take out federal student loans, averaging $6,419 per year.
The New School Undergraduate Student Diversity
There are 3,219 students enrolled at New School University; Parsons The New School for Design; New School for Social Research; Eugene Lang College; Mannes College; The New School for Drama; The New School for Jazz and Contemporary Music; The New School for Public Engagement. New School University; Parsons The New School for Design; New School for Social Research; Eugene Lang College; Mannes College; The New School for Drama; The New School for Jazz and Contemporary Music; The New School for Public Engagement is classified as a 5,000 - 9,999 institution by enrollment size. Its Carnegie Classification is Doctoral Universities: Higher Research Activity.
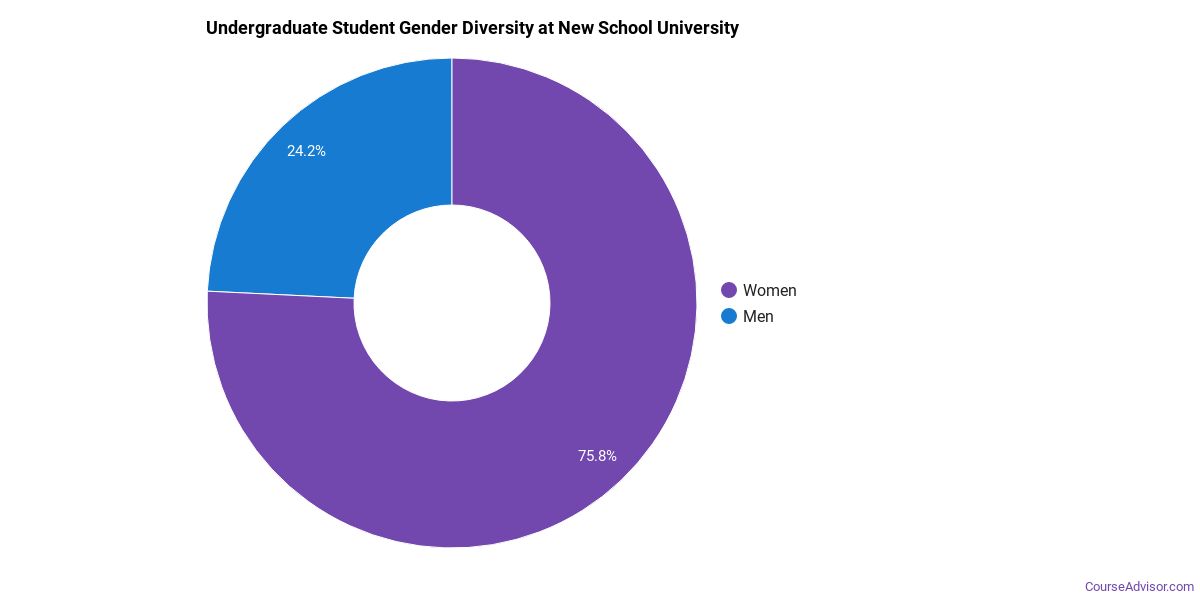
Gender Diversity
Of the 6,819 undergraduate students at New School University; Parsons The New School for Design; New School for Social Research; Eugene Lang College; Mannes College; The New School for Drama; The New School for Jazz and Contemporary Music; The New School for Public Engagement, approximately 23% are male and 77% are female.
Racial-Ethnic Diversity
The racial-ethnic breakdown of The New School undergraduate students is as follows.
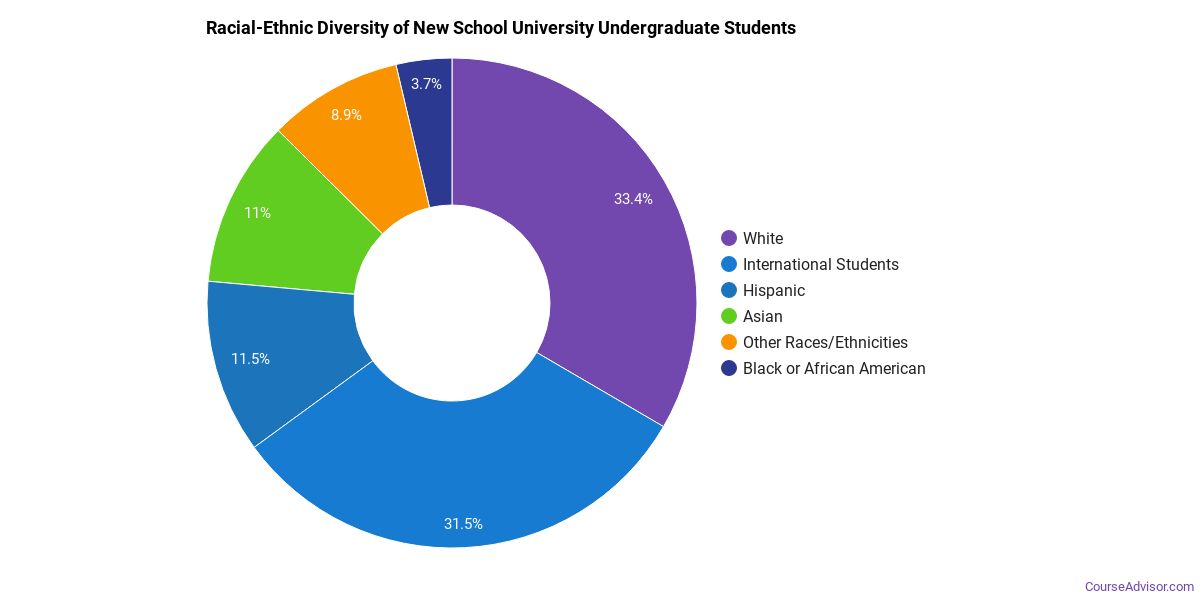
| Race/Ethnicity | Number of Students |
|---|---|
| Asian | 872 |
| Black or African American | 327 |
| Hispanic | 763 |
| White | 2,038 |
| American Indian/Alaska Native | 6 |
| Native Hawaiian/Pacific Islander | 6 |
| Two or More Races | 334 |
| Non-Resident | 2,332 |
Geographic Diversity
The top 5 home states of first-time undergraduate students at New School University; Parsons The New School for Design; New School for Social Research; Eugene Lang College; Mannes College; The New School for Drama; The New School for Jazz and Contemporary Music; The New School for Public Engagement break down as follows.

| State | First-Time UG Students |
|---|---|
| New York | 172 |
| California | 168 |
| New Jersey | 77 |
| Florida | 48 |
| Massachusetts | 38 |
Additionally, approximately 34.2% of undergraduate students are non-resident from outside the United States.
The New School Graduate Student Diversity
2,593 of New School University; Parsons The New School for Design; New School for Social Research; Eugene Lang College; Mannes College; The New School for Drama; The New School for Jazz and Contemporary Music; The New School for Public Engagement’s students are in graduate programs. The highest graduate-level award offered is Doctor’s degree.
Gender Diversity (Graduate)
Among graduate students at New School University; Parsons The New School for Design; New School for Social Research; Eugene Lang College; Mannes College; The New School for Drama; The New School for Jazz and Contemporary Music; The New School for Public Engagement, approximately 31% are male and 69% are female.

Racial-Ethnic Diversity (Graduate)
The racial-ethnic breakdown of The New School graduate students is as follows.

| Race/Ethnicity | Number of Students |
|---|---|
| Asian | 142 |
| Black or African American | 147 |
| Hispanic | 181 |
| White | 749 |
| Two or More Races | 80 |
| Non-Resident | 1,260 |
Online Learning at The New School
New School University; Parsons The New School for Design; New School for Social Research; Eugene Lang College; Mannes College; The New School for Drama; The New School for Jazz and Contemporary Music; The New School for Public Engagement delivers remote learning paths for students who need flexibility.
1,843 undergraduate students at New School University; Parsons The New School for Design; New School for Social Research; Eugene Lang College; Mannes College; The New School for Drama; The New School for Jazz and Contemporary Music; The New School for Public Engagement took at least one online class — of those, 152 took all of their classes online.
At the graduate level, 611 students took at least one online class and 53 took all classes online. Distance education is available at the undergraduate and graduate levels.
Science & Tech Programs at The New School
These science & tech programs are offered at New School University; Parsons The New School for Design; New School for Social Research; Eugene Lang College; Mannes College; The New School for Drama; The New School for Jazz and Contemporary Music; The New School for Public Engagement, with per-level degree counts in the most recent reporting year.
| Program | Bachelor’s | Master’s | Doctorate | Total |
|---|---|---|---|---|
| Architectural Sciences and Technology | 34 | 47 | — | 81 |
| City/Urban, Community, and Regional Planning | — | 7 | — | 7 |
Academic Programs at The New School
New School University; Parsons The New School for Design; New School for Social Research; Eugene Lang College; Mannes College; The New School for Drama; The New School for Jazz and Contemporary Music; The New School for Public Engagement offers 17 distinct academic programs.
The highest level of award offered is Doctor’s degree.
Institutional Profile
New School University; Parsons The New School for Design; New School for Social Research; Eugene Lang College; Mannes College; The New School for Drama; The New School for Jazz and Contemporary Music; The New School for Public Engagement has an open admission policy: No. Credit transfer:
- AP credits: Yes
- Dual enrollment credits: Yes
- Life experience credits: Implied no
References
More about our data sources and methodologies.
Course Advisor provides higher-education, college and university, degree, program, career, salary, and other helpful information to students, faculty, institutions, and other internet audiences. Presented information and data are subject to change. Inclusion on this website does not imply or represent a direct relationship with the company, school, or brand. Information, though believed correct at time of publication, may not be correct, and no warranty is provided. Contact the schools to verify any information before relying on it. Financial aid may be available for those who qualify. The displayed options may include sponsored or recommended results, not necessarily based on your preferences.
© Course Advisor – All Rights Reserved.