Visual & Performing Arts Schools in Massachusetts
Featured schools near , edit
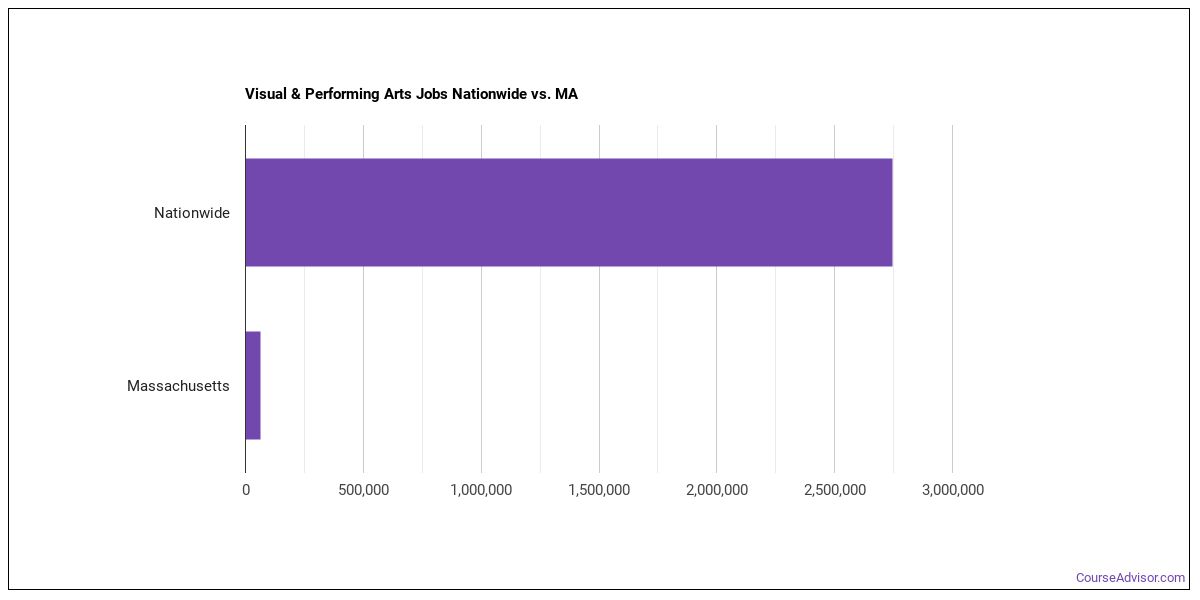
Jobs for Visual & Performing Arts Grads in Massachusetts
There are 72,270 people in the state and 3,063,820 people in the nation working in Visual & Performing Arts jobs.
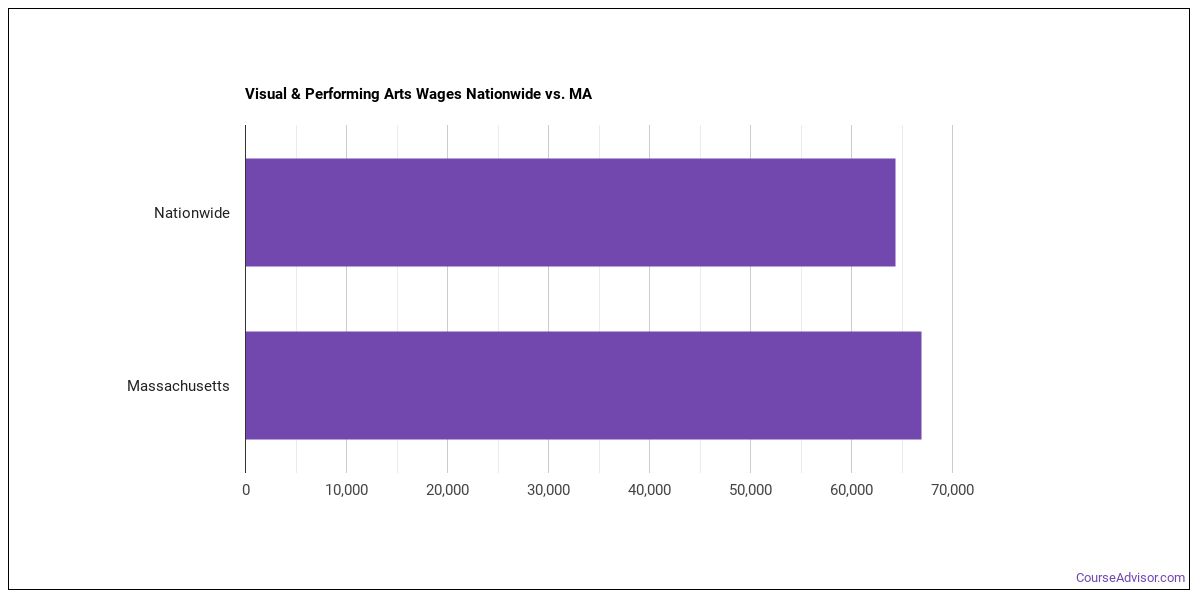
Wages for Visual & Performing Arts Jobs in Massachusetts
A typical salary for a Visual & Performing Arts grad in the state is $106,106, compared to a typical salary of $97,195 nationwide.
Most Popular Visual & Performing Arts Programs in MA
Our data covers 6 colleges in Massachusetts offering Visual & Performing Arts degrees. Learn about the most popular 6 below:

Graduates earn a median salary of $20,342 in their first year after graduation. With an admission rate of 50%, getting in takes some planning. The full-time student retention rate is 85%.
Grads earn a median early-career salary of $30,413 after earning their degree at this institution. With an admission rate of 47%, getting in takes some planning. The full-time student retention rate is 88%.
Graduates earn a median salary of $55,834 in their first year after graduation. With an admission rate of 11%, getting in takes some planning. The full-time student retention rate is 95%.
Graduates earn a median salary of $24,364 in their first year after graduation. About 77% of those who apply are admitted. 84% of full-time students return after their first year.
About 43% of those who apply are admitted. 94% of full-time students return after their first year. Undergrads from Massachusetts pay around $58,550 a year in tuition.
One year after graduating, alumni of this school earn a median of $63,641 a year. With an admission rate of 10%, getting in takes some planning. The full-time student retention rate is 96%.
Visual & Performing Arts Careers in MA
Some of the careers Visual & Performing Arts majors go into include:
| Job Title | Nationwide Job Growth | Nationwide Median Salary |
|---|---|---|
| Art, Drama, and Music Teachers, Postsecondary | — | $46,983 |
| Craft Artists | — | $76,826 |
| Artists and Related Workers, All Other | — | $83,610 |
| Producers and Directors | — | $90,515 |
| Managers, All Other | — | $95,684 |
| Music Directors and Composers | — | $66,915 |
| Fine Artists, Including Painters, Sculptors, and Illustrators | — | $69,338 |
| Choreographers | — | $109,380 |
| Gem and Diamond Workers | — | $66,671 |
| Talent Directors | — | $73,937 |
| Curators | — | $79,764 |
| Graphic Designers | — | $66,386 |
Explore Major by State
Alabama
Arkansas
Connecticut
Florida
Hawaii
Indiana
Kentucky
Maryland
Minnesota
Montana
New Hampshire
New York
Ohio
Pennsylvania
South Carolina
Texas
Virgin Islands
West Virginia
View Nationwide Visual & Performing Arts Report
References
More about our data sources and methodologies.
Course Advisor provides higher-education, college and university, degree, program, career, salary, and other helpful information to students, faculty, institutions, and other internet audiences. Presented information and data are subject to change. Inclusion on this website does not imply or represent a direct relationship with the company, school, or brand. Information, though believed correct at time of publication, may not be correct, and no warranty is provided. Contact the schools to verify any information before relying on it. Financial aid may be available for those who qualify. The displayed options may include sponsored or recommended results, not necessarily based on your preferences.
© Course Advisor – All Rights Reserved.