Film, Video & Photographic Arts
Featured schools near , edit
Types of Degrees Film, Video & Photographic Arts Majors Are Earning
Students pursuing Film, Video & Photographic Arts may pursue degrees at several award levels.
| Award Level | Graduates |
|---|---|
| Certificate | 825 |
| Associate’s Degree | 1,657 |
| Bachelor’s Degree | 13,024 |
| Master’s Degree | 3,295 |
| Doctor’s Degree | 51 |
What Film, Video & Photographic Arts Majors Need to Know
Programs in Film, Video & Photographic Arts emphasize a specific mix of knowledge, skills, and abilities — derived from O*NET surveys of workers in occupations that Film, Video & Photographic Arts graduates commonly enter.
Knowledge Areas
Coursework in Film, Video & Photographic Arts emphasizes the following knowledge areas:
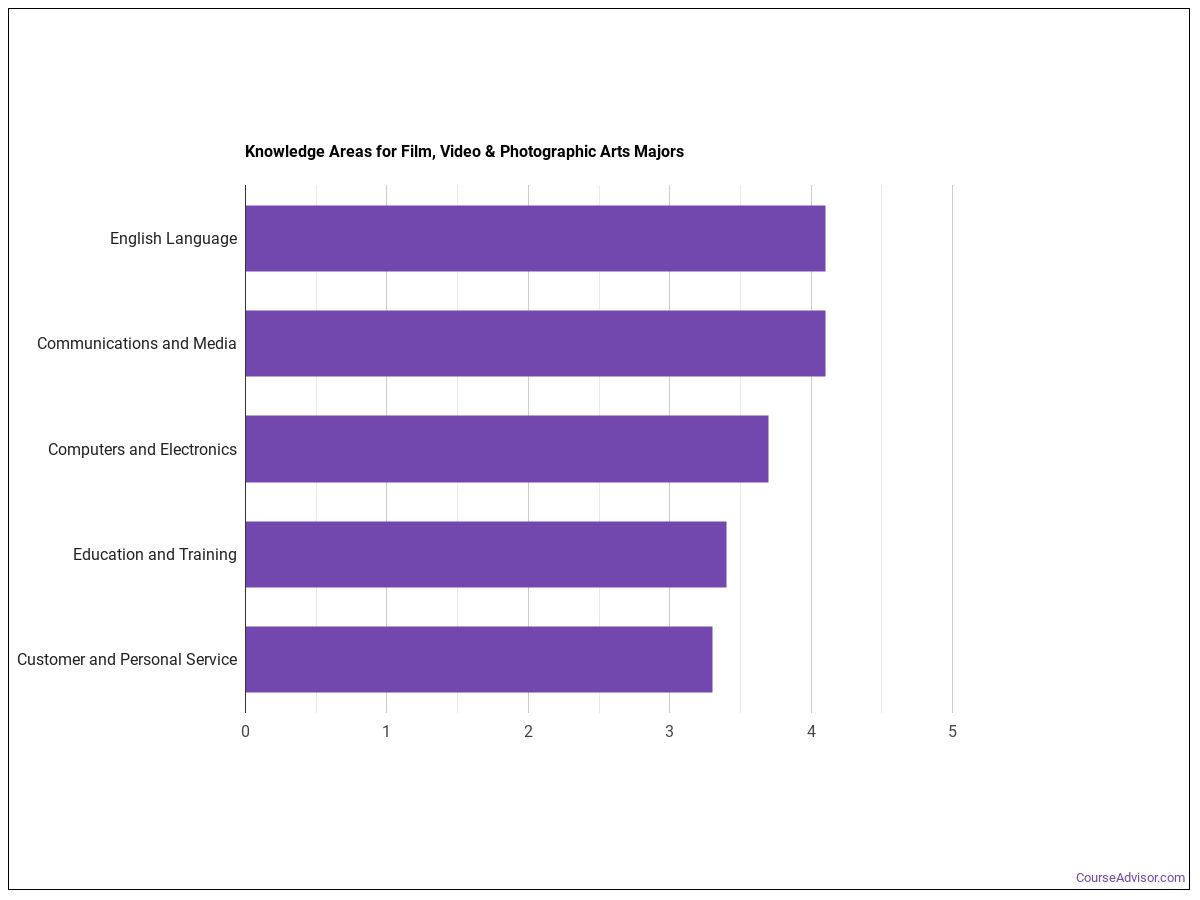
- English Language — Importance 4.3 / 5; level 5.2 / 7.
- Fine Arts — Importance 4.0 / 5; level 4.9 / 7.
- Education and Training — Importance 4.0 / 5; level 5.1 / 7.
- Communications and Media — Importance 4.0 / 5; level 4.7 / 7.
- Computers and Electronics — Importance 3.5 / 5; level 4.0 / 7.
Importance is rated 1–5; level is 1–7. Source: ONET Online — weighted across related occupations.*
Skills
The skill set developed in a Film, Video & Photographic Arts program reflects the day-to-day work of related occupations:
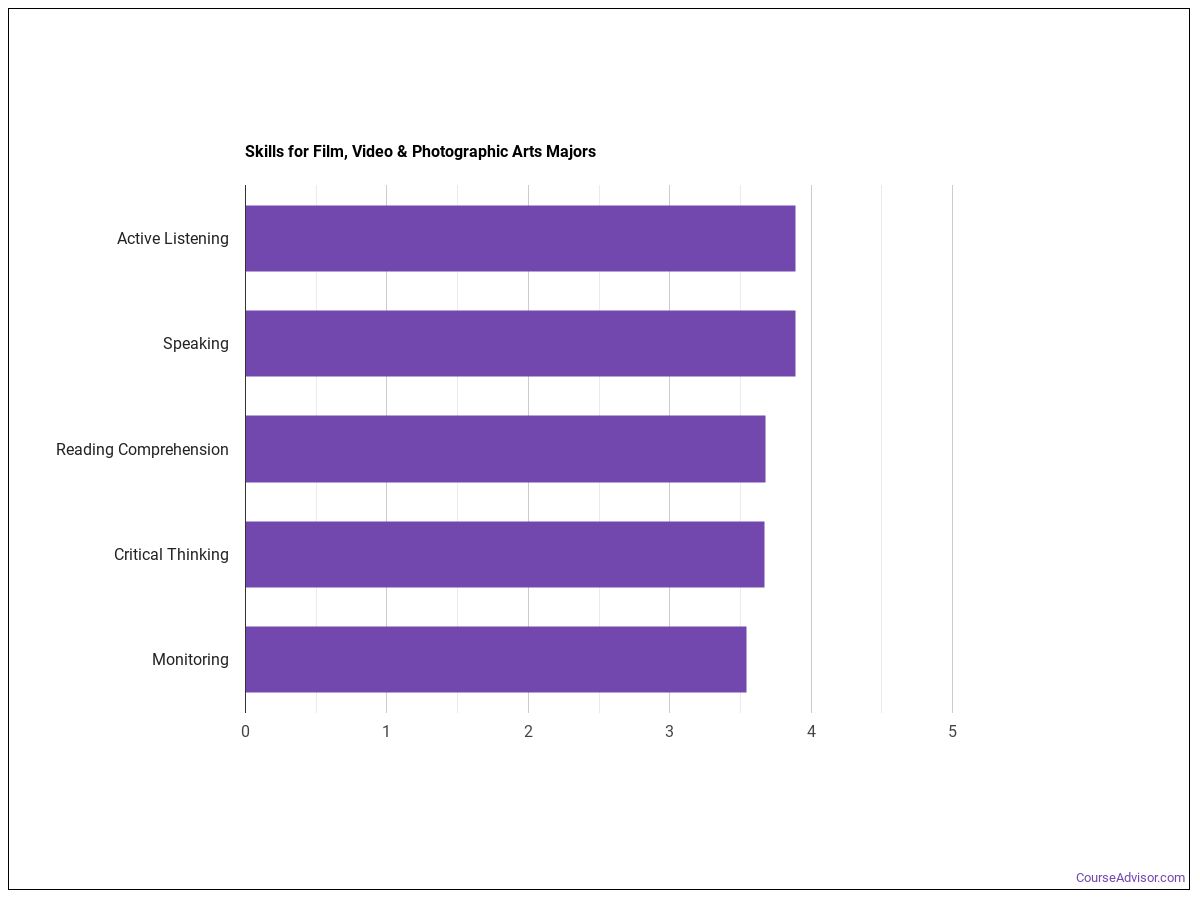
- Speaking — Importance 4.3 / 5; level 4.4 / 7.
- Active Listening — Importance 4.0 / 5; level 4.1 / 7.
- Reading Comprehension — Importance 3.9 / 5; level 4.4 / 7.
- Instructing — Importance 3.8 / 5; level 4.2 / 7.
- Active Learning — Importance 3.7 / 5; level 3.9 / 7.
Abilities
The cognitive and physical abilities most relevant to Film, Video & Photographic Arts careers — again drawn from O*NET surveys of related occupations:

- Oral Expression — Importance 4.2 / 5; level 4.7 / 7.
- Oral Comprehension — Importance 4.0 / 5; level 4.7 / 7.
- Written Comprehension — Importance 4.0 / 5; level 4.6 / 7.
- Speech Clarity — Importance 3.9 / 5; level 4.3 / 7.
- Written Expression — Importance 3.9 / 5; level 4.5 / 7.
Common Job Activities
Day-to-day, Film, Video & Photographic Arts graduates report doing:
| Activity | Frequency / Importance |
|---|---|
| Thinking Creatively | 4.7 / 7 |
| Communicating with Supervisors, Peers, or Subordinates | 4.4 / 7 |
| Making Decisions and Solving Problems | 4.3 / 7 |
| Establishing and Maintaining Interpersonal Relationships | 4.2 / 7 |
| Getting Information | 4.2 / 7 |
| Working with Computers | 4.1 / 7 |
| Organizing, Planning, and Prioritizing Work | 4.1 / 7 |
| Training and Teaching Others | 4.1 / 7 |
| Updating and Using Relevant Knowledge | 4.0 / 7 |
| Coaching and Developing Others | 3.9 / 7 |
Technology Skills Used on the Job
Most frequently-cited tools used by Film, Video & Photographic Arts professionals:
| Tool / Software | Category | In-Demand |
|---|---|---|
| Microsoft Word | Word processing software | — |
| Microsoft Excel | Spreadsheet software | ✓ |
| Microsoft Office software | Office suite software | ✓ |
| Microsoft PowerPoint | Presentation software | ✓ |
| Apple Final Cut Pro | Video creation and editing software | ✓ |
| Adobe Photoshop | Graphics or photo imaging software | ✓ |
| Adobe Creative Cloud software | Graphics or photo imaging software | ✓ |
| Email software | Electronic mail software | — |
| Adobe Illustrator | Graphics or photo imaging software | ✓ |
| Microsoft Outlook | Electronic mail software | — |
| Adobe Acrobat | Document management software | — |
| Adobe Audition | Music or sound editing software | — |
Source: ONET Online technology skills, weighted across related occupations.*
Sample Job Titles
Real job postings for Film, Video & Photographic Arts graduates include:
- College Faculty Member
- Adjunct Professor
- Adjunct Lecturer
- Adjunct Instructor
- Associate Professor
- Professor
- University Faculty Member
- Media Arts Professor
- College Professor
- Assistant Professor
- Instructor
- Art Educator
- Theater Teacher
- Makeup Artistry Instructor
- Visual Arts Instructor
Education Typically Required
Across the occupations open to Film, Video & Photographic Arts graduates, the typical level of education actually held by current workers is distributed as:
| Education Level | Share of Workers |
|---|---|
| Master’s degree | 35.4% |
| Bachelor’s degree | 27.5% |
| Doctoral degree | 19.0% |
| Associate’s degree (or other 2-year) | 6.1% |
| High school diploma or equivalent | 4.7% |
| Some college courses | 2.2% |
| Postsecondary certificate | 1.5% |
| Post-doctoral training | 1.1% |
| Post-master’s certificate | 1.0% |
| Post-baccalaureate certificate | 0.9% |
| First professional degree | 0.4% |
| Less than a high school diploma | 0.1% |
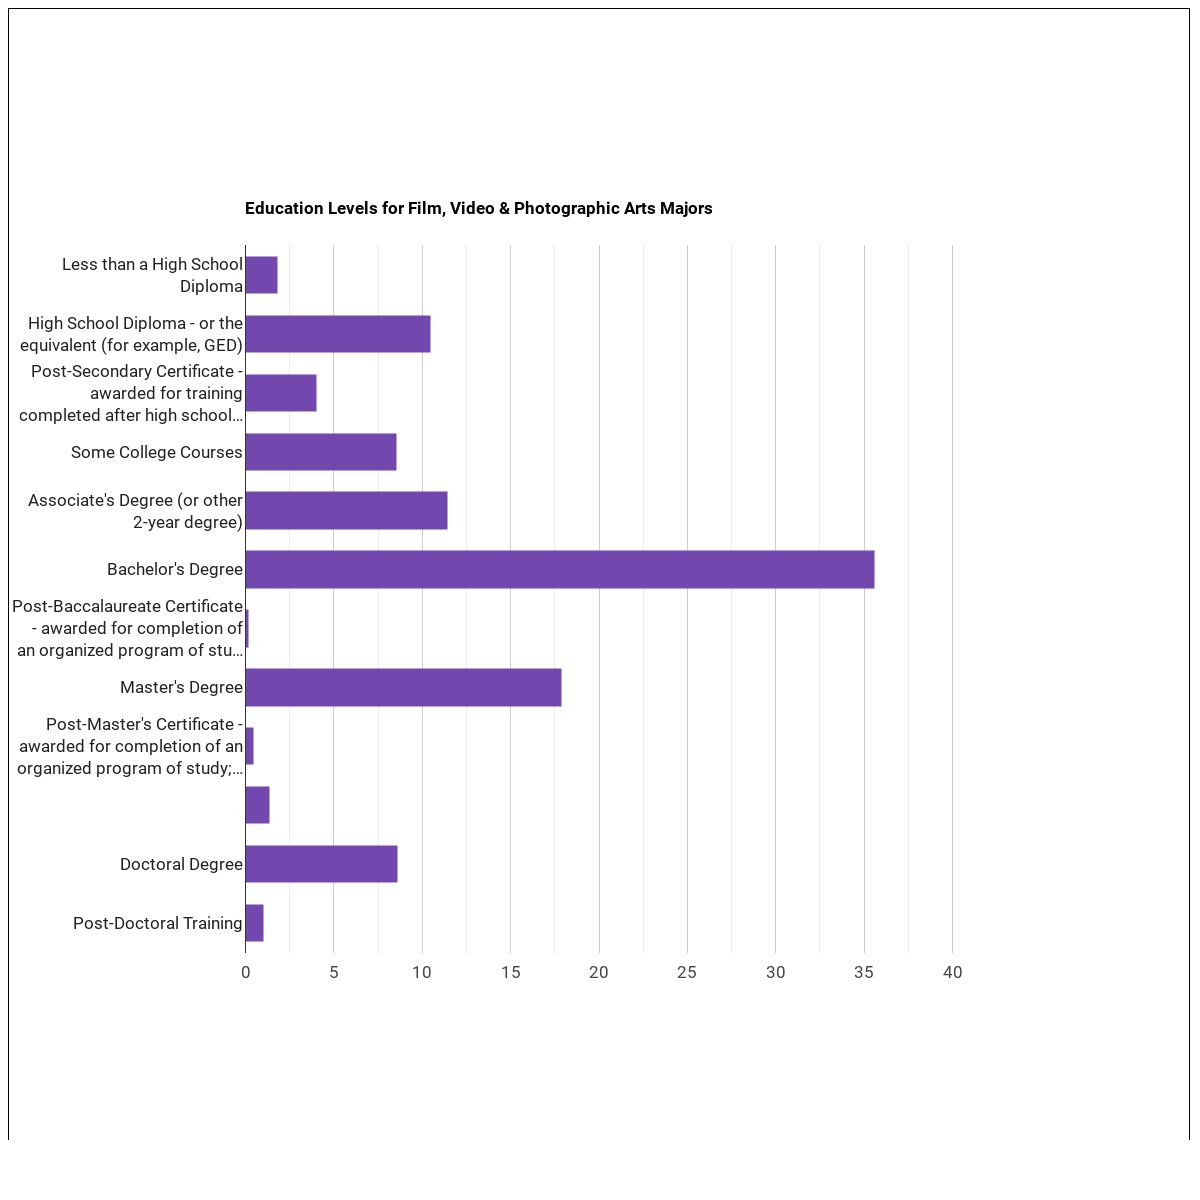
Source: ONET Online education / training / experience requirements.*
Who Is Earning a Degree in Film, Video & Photographic Arts?
Gender Distribution
This field has a relatively balanced gender distribution: 47.7% women and 52.3% men among Film, Video & Photographic Arts graduates.
| Gender | Graduates | Share |
|---|---|---|
| Women | 9,035 | 47.7% |
| Men | 9,892 | 52.3% |
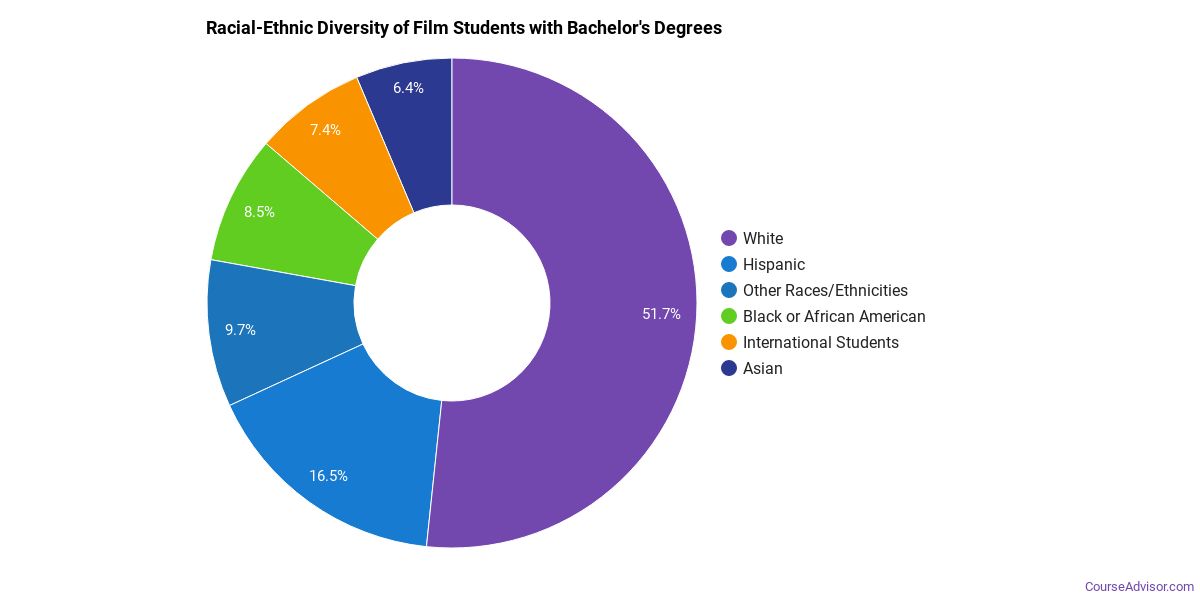
Racial-Ethnic Diversity
At the national level, the racial-ethnic distribution of Film, Video & Photographic Arts graduates is as follows:
| Race / Ethnicity | Graduates | Share |
|---|---|---|
| White | 8,681 | 45.9% |
| Asian | 1,159 | 6.1% |
| Hispanic or Latino | 3,642 | 19.2% |
| Black or African American | 1,955 | 10.3% |
| American Indian / Alaska Native | 80 | 0.4% |
| Native Hawaiian / Pacific Islander | 23 | 0.1% |
| Two or More Races | 943 | 5.0% |
| Race Unknown | 546 | 2.9% |
| International Students | 1,898 | 10.0% |
See minority definition below.
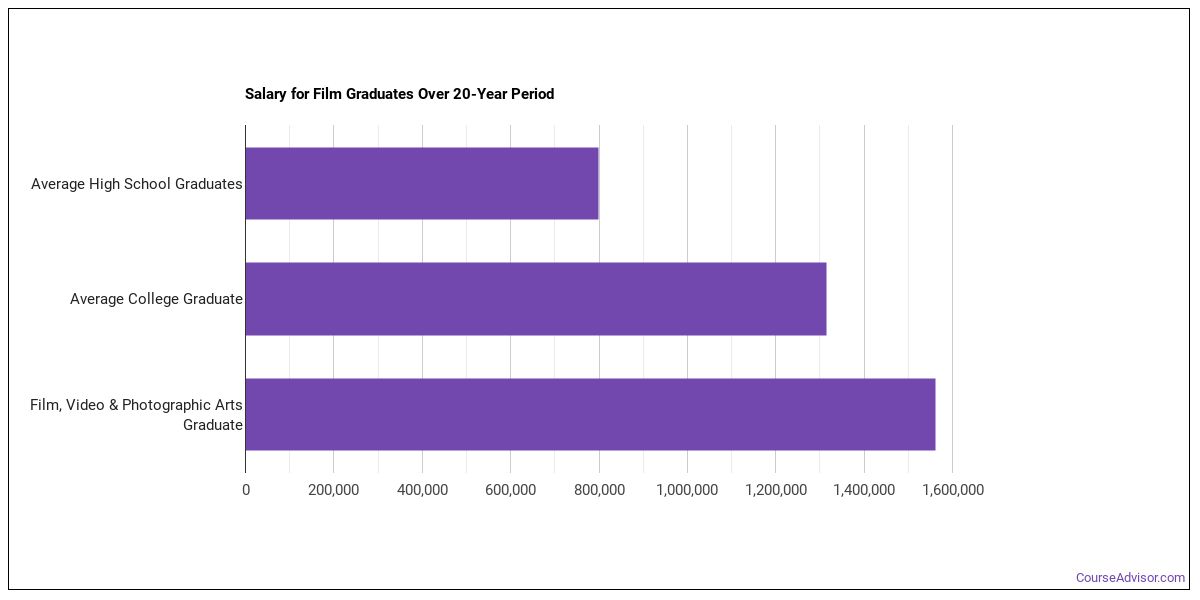
How Much Do Film, Video & Photographic Arts Graduates Earn?
College Scorecard reports median earnings of Film, Video & Photographic Arts graduates 1, 4, and 5 years after completion. These numbers tend to grow steadily as graduates gain experience and move into mid-career roles.
| Years Out | Median Earnings |
|---|---|
| 1 year | $25,545 |
| 4 years | $35,590 |
| 5 years | $41,647 |
By year 5 out, median earnings rise to $41,647 — roughly 63% above the 1-year mark.
Source: U.S. Department of Education College Scorecard, field-of-study earnings tracker.
Online Film, Video & Photographic Arts Programs
Online study is tracked by IPEDS for Film, Video & Photographic Arts. The table below shows how many graduates earned at least some of their coursework online (Distance-Ed Available) versus completing the entire program online (Distance-Ed Only).
| Award Level | Distance-Ed Available | Distance-Ed Only |
|---|---|---|
| Associate’s | 8 | 18 |
| Bachelor’s | 13 | 12 |
| Master’s | 8 | 5 |
Distance-Ed Only = degrees completed entirely online; Distance-Ed Available = degrees including at least some online coursework. Source: IPEDS Completions by Distance Education status.
Is a Degree in Film, Video & Photographic Arts Worth It?
Looking purely at the federal earnings tracker, Film, Video & Photographic Arts graduates earn a median of $35,590 four years after completion — about 6% below the national median for workers with only a high school diploma (~$38,000). On earnings alone, this program does not show an income premium over the baseline; non-financial outcomes (career interests, certification requirements, advancement potential) are typically the stronger argument for fields in this range.
ROI estimate compares the program’s 4-yr median earnings against the 2023 BLS CPS median earnings for high-school-only workers. Source: U.S. Department of Education College Scorecard + BLS Current Population Survey.
Related Programs
You may also be interested in these closely related fields of study:
| Program | CIP Code |
|---|---|
| Visual and Performing Arts | 50 |
| Arts, Entertainment, and Media Management | 50.10 |
| Community/Environmental/Socially-Engaged Art | 50.11 |
| Crafts/Craft Design, Folk Art and Artisanry | 50.02 |
| Dance | 50.03 |
| Design and Applied Arts | 50.04 |
| Drama/Theatre Arts and Stagecraft | 50.05 |
| Fine and Studio Arts | 50.07 |
| Music | 50.09 |
| Visual and Performing Arts, General | 50.01 |
| Visual and Performing Arts, Other | 50.99 |
| VISUAL AND PERFORMING ARTS | 50.00 |
Explore Film, Video & Photographic Arts by State
Alabama
California
District of Columbia
Idaho
Kansas
Maryland
Mississippi
Nevada
New York
Oklahoma
South Carolina
Utah
West Virginia
Alaska
Colorado
Florida
Illinois
Kentucky
Massachusetts
Missouri
New Hampshire
North Carolina
Oregon
South Dakota
Vermont
Wisconsin
References
The racial-ethnic minorities count is calculated by taking the total number of students and subtracting white students and international students. This number is then divided by the total number of students to obtain the racial-ethnic minorities percentage.
- College Factual
- National Center for Education Statistics (IPEDS)
- O*NET Online
- U.S. Bureau of Labor Statistics
- U.S. Department of Education College Scorecard
More about our data sources and methodologies.
Course Advisor provides higher-education, college and university, degree, program, career, salary, and other helpful information to students, faculty, institutions, and other internet audiences. Presented information and data are subject to change. Inclusion on this website does not imply or represent a direct relationship with the company, school, or brand. Information, though believed correct at time of publication, may not be correct, and no warranty is provided. Contact the schools to verify any information before relying on it. Financial aid may be available for those who qualify. The displayed options may include sponsored or recommended results, not necessarily based on your preferences.
© Course Advisor – All Rights Reserved.