Personal & Culinary Services Undergraduate Certificates
There are 1,989 colleges and universities across the nation that offer aundergraduate certificate in Personal & Culinary Services. This degree is more popular with female students, and about61% were students from underrepresented racial-ethnic groups. Also, 0.3% of Personal & Culinary Services graduates were international students.
Featured schools near , edit
Education Levels of Personal & Culinary Services Majors
In the most recent year for which data is available, 164,764 degrees were awarded toPersonal & Culinary Services majors across all award levels. The following table shows the number of diplomas awarded in Personal & Culinary Services at each degree level.
| Education Level | Number of Grads |
|---|---|
| Certificate (this page) | 77,747 |
| Associate’s Degree | 11,276 |
| Bachelor’s Degree | 665 |
| Master’s Degree | 68,933 |
Earnings of Personal & Culinary Services Majors With Undergraduate Certificates (All Award Levels)
The U.S. Department of Education reports a median salary for graduates with aundergraduate certificate in Personal & Culinary Services of $21,507 four years after graduation. These figures are reported program-wide, across all award levels.
A lot of factors can contribute to this number, such as the location of your workplace and the availability of other perks and bonuses.
| Years After Graduation | Median Earnings |
|---|---|
| 1 year | $18,199 |
| 4 years | $21,507 |
| 5 years | $23,957 |
Source: U.S. Department of Education College Scorecard, field-of-study earnings tracker (program-wide, all award levels).
Student Debt (All Award Levels)
The data on debt ranges for Personal & Culinary Services majors who have their undergraduate certificate is not currently available.
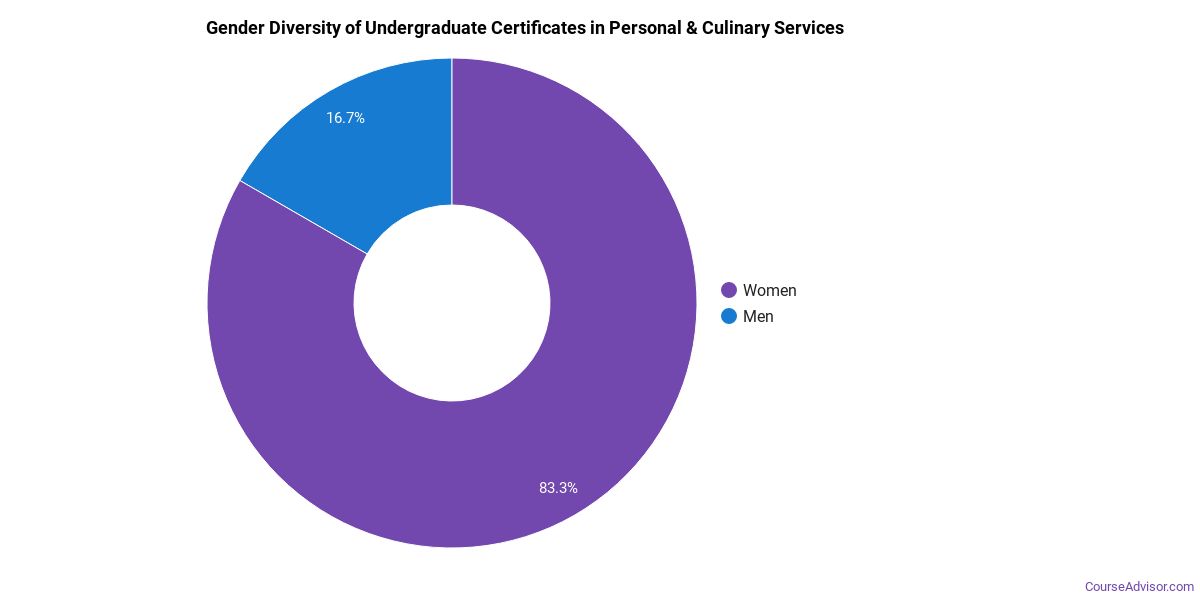
Student Diversity
More women than men pursue their undergraduate certificate in Personal & Culinary Services. About 82.2% of graduates with this degree are women.
| Gender | Number of Grads |
|---|---|
| Men | 13,804 |
| Women | 63,943 |
The racial-ethnic distribution of Personal & Culinary Services graduates is as follows:
| Race / Ethnicity | Number of Grads | Share |
|---|---|---|
| White | 30,431 | 39.1% |
| Asian | 1,836 | 2.4% |
| Hispanic or Latino | 24,947 | 32.1% |
| Black or African American | 14,412 | 18.5% |
| American Indian / Alaska Native | 701 | 0.9% |
| Native Hawaiian / Pacific Islander | 219 | 0.3% |
| Two or More Races | 2,657 | 3.4% |
| Race Unknown | 2,275 | 2.9% |
| International Students | 269 | 0.3% |
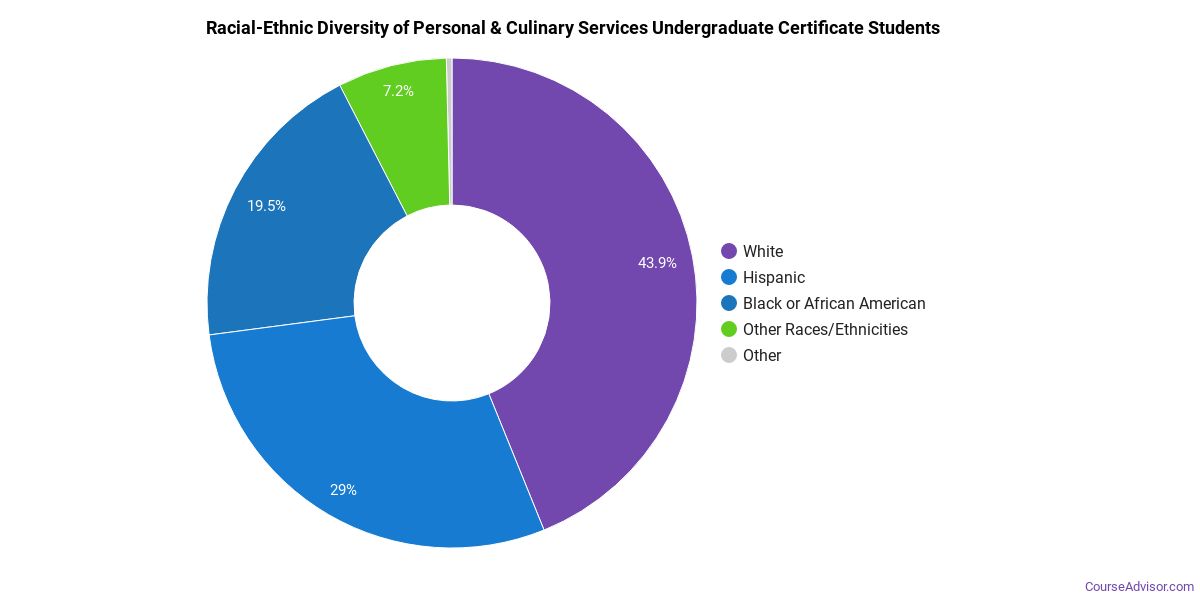
This degree is not very popular with international students. Only 0.3% of graduates fall into this category.
See the minority definition in the References below.
Most Popular Personal & Culinary Services Programs for Undergraduate Certificates
There are 2,058 colleges that offer a undergraduate certificate in Personal & Culinary Services. Learn more about the most popular below:

The most popular school in the United States for Personal & Culinary Services students seeking a undergraduate certificate is NUC University. This school awarded 4,210 undergraduate certificates in Personal & Culinary Services in the most recent reporting year. Data shows that graduates who hold this degree go on to make a median salary of $40,669.
Auguste Escoffier School of Culinary Arts-Boulder is a popular choice for Personal & Culinary Services majors seeking their undergraduate certificate. This school awarded 3,456 undergraduate certificates in Personal & Culinary Services in the most recent reporting year. Data shows that graduates who hold this degree go on to make a median salary of $40,669.
Aveda Arts & Sciences Institute-Covington comes in at #3 on our list of the most popular colleges offering undergraduate certificates in Personal & Culinary Services. This school awarded 1,941 undergraduate certificates in Personal & Culinary Services in the most recent reporting year. Data shows that graduates who hold this degree go on to make a median salary of $40,669.
Evergreen Beauty and Barber College-Everett is a popular choice for Personal & Culinary Services majors seeking their undergraduate certificate. During the most recent year for which we have data, 994 people received their undergraduate certificate in Personal & Culinary Services from this school. Graduates who complete their undergraduate certificate in Personal & Culinary Services here go on to a median salary of $40,669.
Douglas J Aveda Institute comes in at #5 on our list of the most popular colleges offering undergraduate certificates in Personal & Culinary Services. This school awarded 832 undergraduate certificates in Personal & Culinary Services in the most recent reporting year. Data shows that graduates who hold this degree go on to make a median salary of $40,669.
Christine Valmy International School for Esthetics, Skin Care & Makeup comes in at #6 on our list of the most popular colleges offering undergraduate certificates in Personal & Culinary Services. During the most recent year for which we have data, 786 people received their undergraduate certificate in Personal & Culinary Services from this school. Data shows that graduates who hold this degree go on to make a median salary of $40,669.
Culinary Institute of America comes in at #7 on our list of the most popular colleges offering undergraduate certificates in Personal & Culinary Services. This school awarded 756 undergraduate certificates in Personal & Culinary Services in the most recent reporting year. Data shows that graduates who hold this degree go on to make a median salary of $40,669.
Aveda Institute-South Florida is a popular choice for Personal & Culinary Services majors seeking their undergraduate certificate. During the most recent year for which we have data, 746 people received their undergraduate certificate in Personal & Culinary Services from this school. Data shows that graduates who hold this degree go on to make a median salary of $40,669.
Crescent City Bartending School comes in at #9 on our list of the most popular colleges offering undergraduate certificates in Personal & Culinary Services. This school awarded 590 undergraduate certificates in Personal & Culinary Services in the most recent reporting year. Graduates who complete their undergraduate certificate in Personal & Culinary Services here go on to a median salary of $40,669.
Celebrity School of Beauty comes in at #10 on our list of the most popular colleges offering undergraduate certificates in Personal & Culinary Services. During the most recent year for which we have data, 582 people received their undergraduate certificate in Personal & Culinary Services from this school. Graduates who complete their undergraduate certificate in Personal & Culinary Services here go on to a median salary of $40,669.
Institute of Culinary Education comes in at #11 on our list of the most popular colleges offering undergraduate certificates in Personal & Culinary Services. This school awarded 582 undergraduate certificates in Personal & Culinary Services in the most recent reporting year. Graduates who complete their undergraduate certificate in Personal & Culinary Services here go on to a median salary of $40,669.
Aveda Institute-Tallahassee comes in at #12 on our list of the most popular colleges offering undergraduate certificates in Personal & Culinary Services. This school awarded 557 undergraduate certificates in Personal & Culinary Services in the most recent reporting year. Graduates who complete their undergraduate certificate in Personal & Culinary Services here go on to a median salary of $40,669.
Asian-American International Beauty College comes in at #13 on our list of the most popular colleges offering undergraduate certificates in Personal & Culinary Services. During the most recent year for which we have data, 548 people received their undergraduate certificate in Personal & Culinary Services from this school. Graduates who complete their undergraduate certificate in Personal & Culinary Services here go on to a median salary of $40,669.
Euphoria Institute of Beauty Arts & Sciences-Summerlin comes in at #14 on our list of the most popular colleges offering undergraduate certificates in Personal & Culinary Services. During the most recent year for which we have data, 544 people received their undergraduate certificate in Personal & Culinary Services from this school. Data shows that graduates who hold this degree go on to make a median salary of $40,669.
Studio Academy of Beauty comes in at #15 on our list of the most popular colleges offering undergraduate certificates in Personal & Culinary Services. During the most recent year for which we have data, 539 people received their undergraduate certificate in Personal & Culinary Services from this school. Data shows that graduates who hold this degree go on to make a median salary of $40,669.
Advance Beauty College comes in at #16 on our list of the most popular colleges offering undergraduate certificates in Personal & Culinary Services. This school awarded 483 undergraduate certificates in Personal & Culinary Services in the most recent reporting year. Data shows that graduates who hold this degree go on to make a median salary of $40,669.
Central Georgia Technical College comes in at #17 on our list of the most popular colleges offering undergraduate certificates in Personal & Culinary Services. This school awarded 466 undergraduate certificates in Personal & Culinary Services in the most recent reporting year. Data shows that graduates who hold this degree go on to make a median salary of $40,669.
Wiregrass Georgia Technical College is a popular choice for Personal & Culinary Services majors seeking their undergraduate certificate. During the most recent year for which we have data, 447 people received their undergraduate certificate in Personal & Culinary Services from this school. Data shows that graduates who hold this degree go on to make a median salary of $40,669.
Milan Institute-Clovis comes in at #19 on our list of the most popular colleges offering undergraduate certificates in Personal & Culinary Services. During the most recent year for which we have data, 434 people received their undergraduate certificate in Personal & Culinary Services from this school. Data shows that graduates who hold this degree go on to make a median salary of $40,669.
Penrose Academy comes in at #20 on our list of the most popular colleges offering undergraduate certificates in Personal & Culinary Services. During the most recent year for which we have data, 419 people received their undergraduate certificate in Personal & Culinary Services from this school. Graduates who complete their undergraduate certificate in Personal & Culinary Services here go on to a median salary of $40,669.
Personal & Culinary Services Focus Areas
| Major | Annual Degrees Awarded |
|---|---|
| Cosmetology and Related Personal Grooming Services | 136,936 |
| Culinary Arts and Related Services | 24,487 |
| Funeral Service and Mortuary Science | 2,676 |
| Casino Operations and Services | 564 |
| Culinary, Entertainment, and Personal Services, Other | 101 |
Explore Personal & Culinary Services by State
Alabama
California
District of Columbia
Idaho
Kansas
Maryland
Mississippi
Nevada
New York
Oklahoma
South Carolina
Utah
West Virginia
Alaska
Colorado
Florida
Illinois
Kentucky
Massachusetts
Missouri
New Hampshire
North Carolina
Oregon
South Dakota
Vermont
Wisconsin
References
The racial-ethnic minority student count is calculated by taking the total number of students and subtracting white students, international students, and students whose race/ethnicity was unknown. This number is then divided by the total number of students to obtain the percentage of racial-ethnic minorities.
- College Factual
- National Center for Education Statistics (IPEDS)
- O*NET Online
- U.S. Bureau of Labor Statistics
- U.S. Department of Education College Scorecard
More about our data sources and methodologies.
Course Advisor provides higher-education, college and university, degree, program, career, salary, and other helpful information to students, faculty, institutions, and other internet audiences. Presented information and data are subject to change. Inclusion on this website does not imply or represent a direct relationship with the company, school, or brand. Information, though believed correct at time of publication, may not be correct, and no warranty is provided. Contact the schools to verify any information before relying on it. Financial aid may be available for those who qualify. The displayed options may include sponsored or recommended results, not necessarily based on your preferences.
© Course Advisor – All Rights Reserved.