Personal & Culinary Services Schools in District of Columbia
Featured schools near , edit
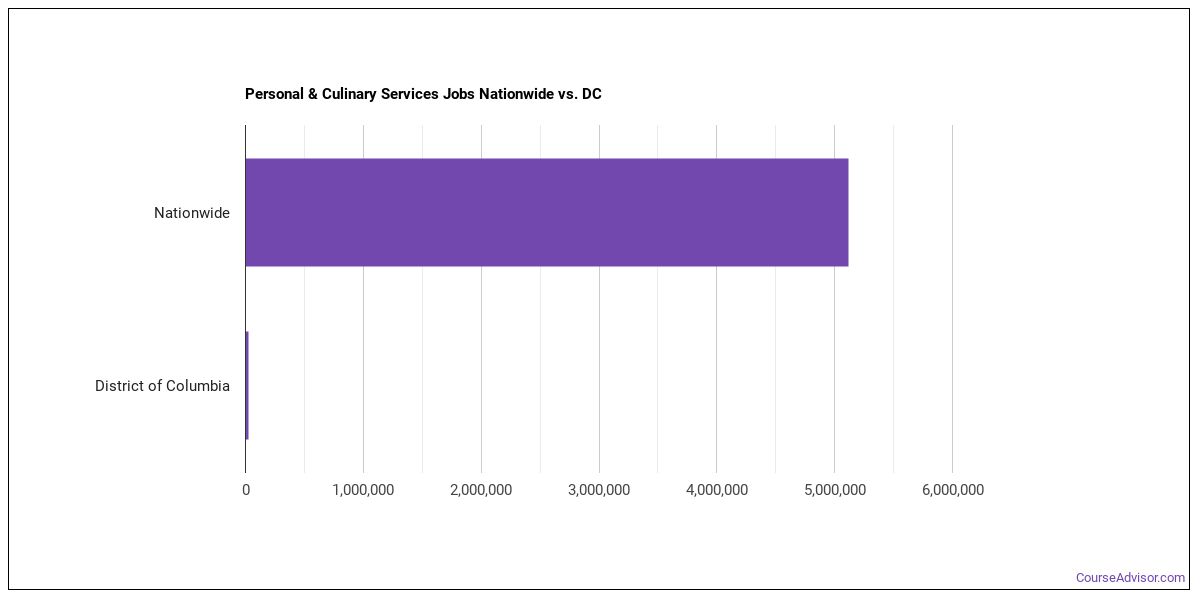
Jobs for Personal & Culinary Services Grads in District of Columbia
In this state, there are 27,600 people employed in jobs related to a Personal & Culinary Services degree, compared to 5,772,600 nationwide.
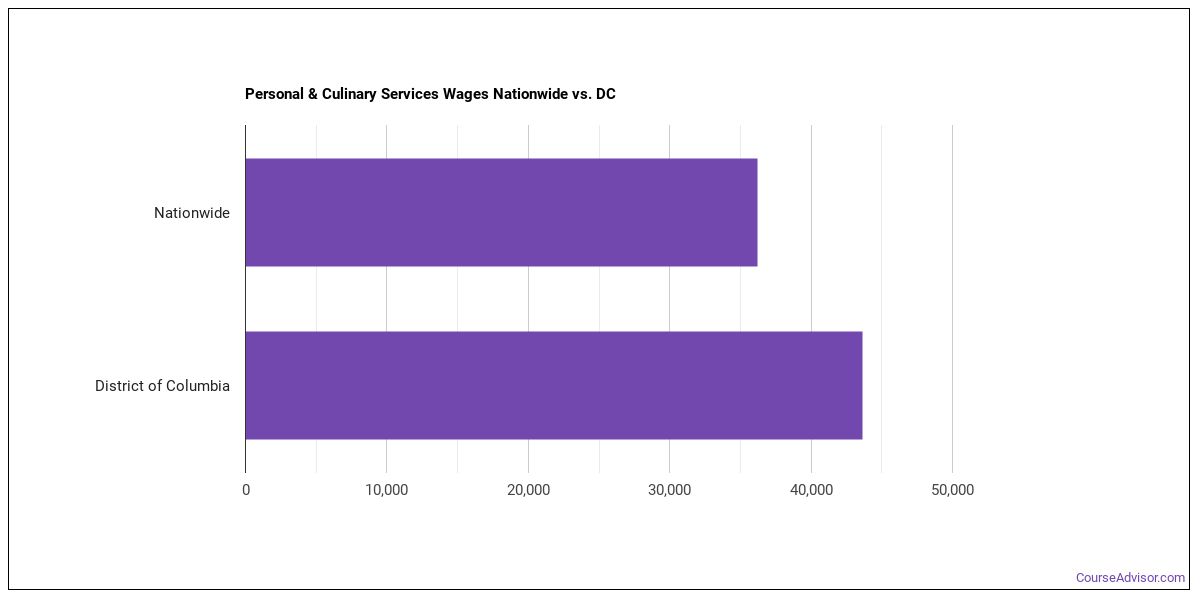
Wages for Personal & Culinary Services Jobs in District of Columbia
Personal & Culinary Services grads earn an average of $54,650 in the state and $44,664 nationwide.
Personal & Culinary Services Careers in DC
Some of the careers Personal & Culinary Services majors go into include:
| Job Title | Nationwide Job Growth | Nationwide Median Salary |
|---|---|---|
| Chefs and Head Cooks | — | $35,292 |
| Cooks, Private Household | — | $35,204 |
| Cooks, Restaurant | — | $41,438 |
| First-Line Supervisors of Food Preparation and Serving Workers | — | $37,104 |
| Hairdressers, Hairstylists, and Cosmetologists | — | $39,017 |
| Cooks, Institution and Cafeteria | — | $30,453 |
| Cooks, All Other | — | $36,782 |
| Morticians, Undertakers, and Funeral Arrangers | — | $58,312 |
| Food Service Managers | — | $165,782 |
| Embalmers | — | $35,965 |
| Postsecondary Teachers, All Other | — | $68,967 |
| Makeup Artists, Theatrical and Performance | — | $36,599 |
Explore Major by State
Alabama
Arkansas
Connecticut
Florida
Hawaii
Indiana
Kentucky
Maryland
Minnesota
Montana
New Hampshire
New York
Ohio
Pennsylvania
South Carolina
Texas
Virgin Islands
West Virginia
View Nationwide Personal & Culinary Services Report
References
More about our data sources and methodologies.
Course Advisor provides higher-education, college and university, degree, program, career, salary, and other helpful information to students, faculty, institutions, and other internet audiences. Presented information and data are subject to change. Inclusion on this website does not imply or represent a direct relationship with the company, school, or brand. Information, though believed correct at time of publication, may not be correct, and no warranty is provided. Contact the schools to verify any information before relying on it. Financial aid may be available for those who qualify. The displayed options may include sponsored or recommended results, not necessarily based on your preferences.
© Course Advisor – All Rights Reserved.