Chefs and Head Cooks in District of Columbia
Considering working as a Chefs and Head Cooks in District of Columbia? Here’s what you need to know. Direct and may participate in the preparation, seasoning, and cooking of salads, soups, fish, meats, vegetables, desserts, or other foods. May plan and price menu items, order supplies, and keep records and accounts.
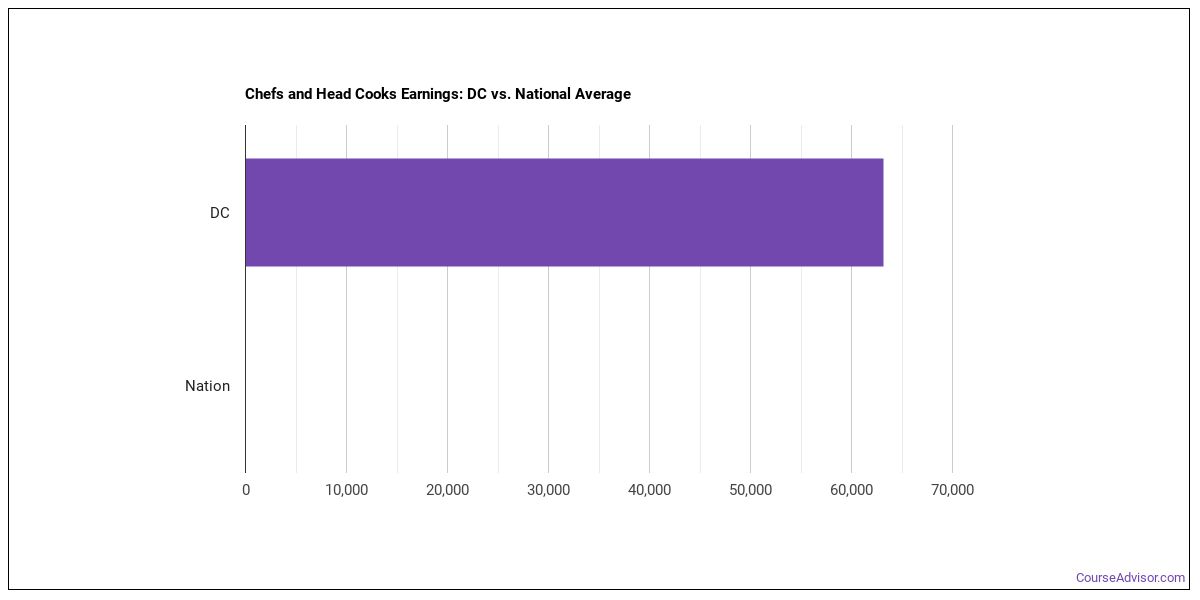
What do Chefs and Head Cooks Make in District of Columbia?
The chefs and head cooks working in District of Columbia, the typical annual salary is $74,000 per year (or about $35.58/hour).Pay can range from $55,130 at the 10th percentile to $109,370 at the 90th percentile.
| Wage Statistic | Annual | Hourly |
|---|---|---|
| 10th percentile | $55,130 | $26.51 |
| 25th percentile | $61,770 | $29.70 |
| Median (50th) | $74,000 | $35.58 |
| 75th percentile | $84,710 | $40.73 |
| 90th percentile | $109,370 | $52.58 |

The job concentration index in District of Columbia compared to the national average — is 2.31, meaning that chefs and head cooks are more concentrated here than the national average.
National Wage Comparison
Nationally, chefs and head cooks earn a median of $35,292 per year ($16.97/hour), higher than the District of Columbia median.
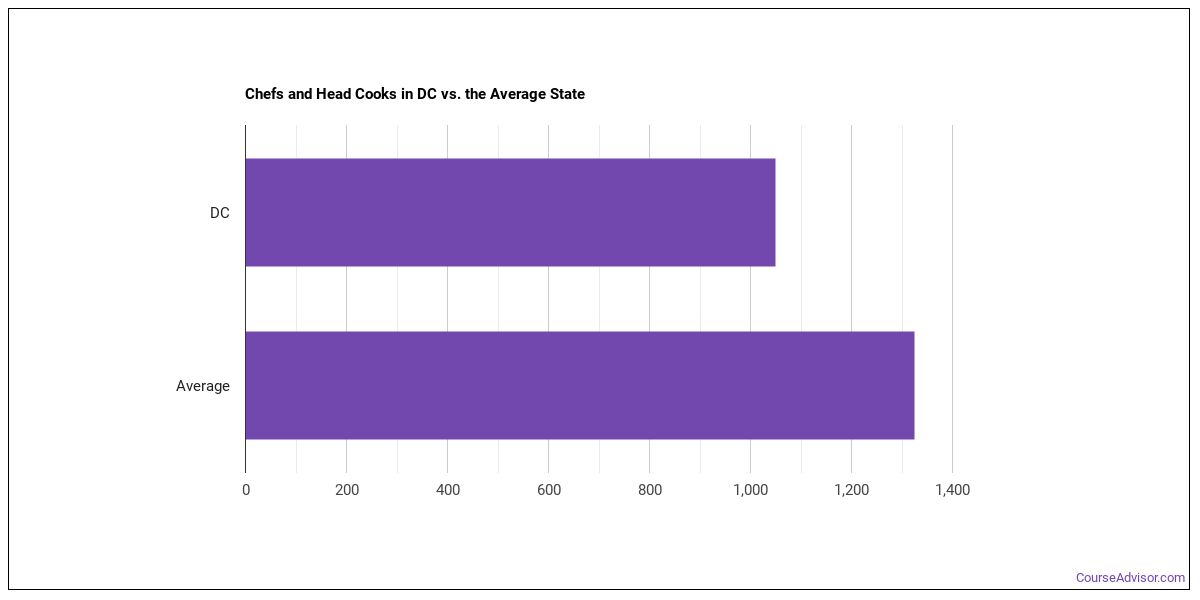
Employment Outlook
There are roughly 1,181,220 chefs and head cooks in the U.S.. In District of Columbia alone, approximately 1,940 people work in this role. That puts the state above the typical state, which employs around 1,860 chefs and head cooks.

Top District of Columbia Metros for Chefs and Head Cooks
These are the District of Columbia metros with the most chefs and head cooks in District of Columbia.
| Metro Area | Number Employed | Annual Median Salary |
|---|---|---|
| Washington-Arlington-Alexandria, DC-VA-MD-WV | 4,480 | $68,260 |
Top States for Chefs and Head Cooks Employment
These states have the highest employment of chefs and head cooks work.
| State | Number Employed |
|---|---|
| California | 26,500 |
| Florida | 17,170 |
| Texas | 16,550 |
| New York | 15,420 |
| Pennsylvania | 7,060 |
| New Jersey | 6,060 |
| Illinois | 5,540 |
| Massachusetts | 5,330 |
| Michigan | 5,310 |
| Nevada | 4,560 |
| Georgia | 4,390 |
| Colorado | 4,180 |
| North Carolina | 4,100 |
| Ohio | 4,040 |
| Virginia | 3,900 |
| Washington | 3,840 |
| Oregon | 3,640 |
| Connecticut | 3,600 |
| Maryland | 3,310 |
| Arizona | 3,260 |
Highest-Paying States for Chefs and Head Cooks
Where chefs and head cooks earn the most: chefs and head cooks.
| State | Annual Median Salary |
|---|---|
| Hawaii | $81,200 |
| Rhode Island | $79,160 |
| North Dakota | $76,630 |
| District of Columbia | $74,000 |
| Massachusetts | $71,330 |
| Washington | $69,800 |
| New Jersey | $69,660 |
| California | $66,780 |
| Delaware | $65,290 |
| Wyoming | $64,790 |
Skills
Top chefs and head cooks skills, rated on an importance scale of 0 to 5:
Knowledge Areas
Key knowledge areas for this occupation, rated on an importance scale of 0 to 5:
Abilities
Key abilities for chefs and head cooks, rated on an importance scale of 0 to 5:
Daily Tasks
Day-to-day, chefs and head cooks typically:
- Monitor sanitation practices to ensure that employees follow standards and regulations.
- Instruct cooks or other workers in the preparation, cooking, garnishing, or presentation of food.
- Supervise or coordinate activities of cooks or workers engaged in food preparation.
- Order or requisition food or other supplies needed to ensure efficient operation.
- Inspect supplies, equipment, or work areas to ensure conformance to established standards.
- Check the quantity and quality of received products.
- Check the quality of raw or cooked food products to ensure that standards are met.
- Estimate amounts and costs of required supplies, such as food and ingredients.
- Coordinate planning, budgeting, or purchasing for all the food operations within establishments such as clubs, hotels, or restaurant chains.
- Analyze recipes to assign prices to menu items, based on food, labor, and overhead costs.
- Plan, direct, or supervise food preparation or cooking activities of multiple kitchens or restaurants in an establishment such as a restaurant chain, hospital, or hotel.
- Determine how food should be presented and create decorative food displays.
Work Activities
- Training and Teaching Others
- Coordinating the Work and Activities of Others
- Developing and Building Teams
- Organizing, Planning, and Prioritizing Work
- Getting Information
- Coaching and Developing Others
- Making Decisions and Solving Problems
- Guiding, Directing, and Motivating Subordinates
- Communicating with Supervisors, Peers, or Subordinates
- Establishing and Maintaining Interpersonal Relationships
- Scheduling Work and Activities
- Identifying Objects, Actions, and Events
Tools & Technology
Software and systems commonly involved: Hot technologies: Facebook In-demand technologies: Microsoft Excel
What Major Will Prepare You For This Career?
Programs that train for this career include:
- Culinary Arts
Featured schools near , edit
Related Careers
Related occupations to chefs and head cooks include:
- Food Service Managers
- Dietetic Technicians
- First-Line Supervisors of Food Preparation and Serving Workers
- Cooks, Fast Food
- Cooks, Institution and Cafeteria
- Cooks, Private Household
Also Known As
Baker, Banquet Chef, Bread and Pastry Baker, Cake Froster, Cake Icer, Cake Maker, Cake Mixer, Certified Executive Chef (CEC), Chef, Chef Manager, Chef de Cuisine, Chef de Froid, Chocolatier, Confectioner, Cook.
References
- U.S. Bureau of Labor Statistics, Occupational Employment and Wage Statistics — https://www.bls.gov/oes/
- O*NET Online — https://www.onetonline.org/
- BLS Employment Projections — https://www.bls.gov/emp/
- O*NET-SOC code: 35-1011.00
Course Advisor provides higher-education, college and university, degree, program, career, salary, and other helpful information to students, faculty, institutions, and other internet audiences. Presented information and data are subject to change. Inclusion on this website does not imply or represent a direct relationship with the company, school, or brand. Information, though believed correct at time of publication, may not be correct, and no warranty is provided. Contact the schools to verify any information before relying on it. Financial aid may be available for those who qualify. The displayed options may include sponsored or recommended results, not necessarily based on your preferences.
© Course Advisor – All Rights Reserved.