National University College Overview
Located in Bayamon, Puerto Rico, National University College is a private for-profit institution. The location of the school is great for students who enjoy the amenities of city life.
What Is National University College Known For?
- The master's degree is the highest award offered at National University College.
- For the 2021-2022 academic year, 15% of the faculty were full-time.
Featured schools near , edit
Where Is National University College?

Contact details for National University College are given below.
| Contact Details | |
|---|---|
| Address: | Carr. #2 Edificio National College Plaza, Bayamon, PR 00960 |
| Phone: | 787-982-3000 |
| Website: | www.nuc.edu |
How Do I Get Into National University College?
You can apply to National University College online at: www.nuc.edu/
Can I Afford National University College?
Student Loan Debt
It's not uncommon for college students to take out loans to pay for school. In fact, almost 66% of students nationwide depend at least partially on loans. At National University College, approximately 39% of students took out student loans averaging $8,718 a year. That adds up to $34,872 over four years for those students.
National University College Undergraduate Student Diversity

There are also 1,189 graduate students at the school.
Gender Diversity
Of the 12,300 full-time undergraduates at National University College, 36% are male and 64% are female.

Racial-Ethnic Diversity
The racial-ethnic breakdown of National University College students is as follows.

| Race/Ethnicity | Number of Grads |
|---|---|
| Asian | 29 |
| Black or African American | 537 |
| Hispanic or Latino | 11,068 |
| White | 460 |
| International Students | 2 |
| Other Races/Ethnicities | 204 |
Geographic Diversity
Puerto Rico students aren't the only ones who study at National University College. At this time, 22 states are represented by the student population at the school.
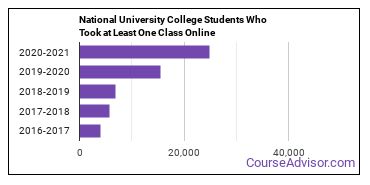
Online Learning at National University College
The following chart shows how the online learning population at National University College has changed over the last few years.

National University College Undergraduate Concentrations
The table below shows the number of awards for each concentration.
References
*The racial-ethnic minorities count is calculated by taking the total number of students and subtracting white students, international students, and students whose race/ethnicity was unknown. This number is then divided by the total number of students at the school to obtain the racial-ethnic minorities percentage.
More about our data sources and methodologies.
Featured Schools
 Request Info
|
Southern New Hampshire University You have goals. Southern New Hampshire University can help you get there. Whether you need a bachelor's degree to get into a career or want a master's degree to move up in your current career, SNHU has an online program for you. Find your degree from over 200 online programs. Learn More > |
