General Biology at Linfield University
What traits are you looking for in a school for General Biology, you may want to check out the program at Linfield University. We’ve gathered the following information to help you decide.
Linfield University is located in McMinnville, OR.
During the most recent reporting year, 13 general biology degrees were granted at Linfield University.
Featured schools near , edit
Studying Online at Linfield University
Many students take online classes at Linfield University. Among 1,709 students, 105 (6%) studied exclusively online and 286 (17%) took at least some classes online.
General Biology Rankings at Linfield University
Use these rankings to compare Linfield University’s General Biology program to other colleges that offer this major.
Bachelor’s-Level Rankings
| Ranking | Scope | Rank |
|---|---|---|
| Best Schools (Quality) | Oregon | #6 of 15 |
| Best Value | Oregon | #10 of 15 |
| Best Schools (Quality) | Far Western (Region) | #117 of 189 |
| Best Value | Far Western (Region) | #155 of 187 |
| Best Schools (Quality) | Nationwide | #659 of 1,249 |
| Best Value | Nationwide | #1035 of 1,237 |
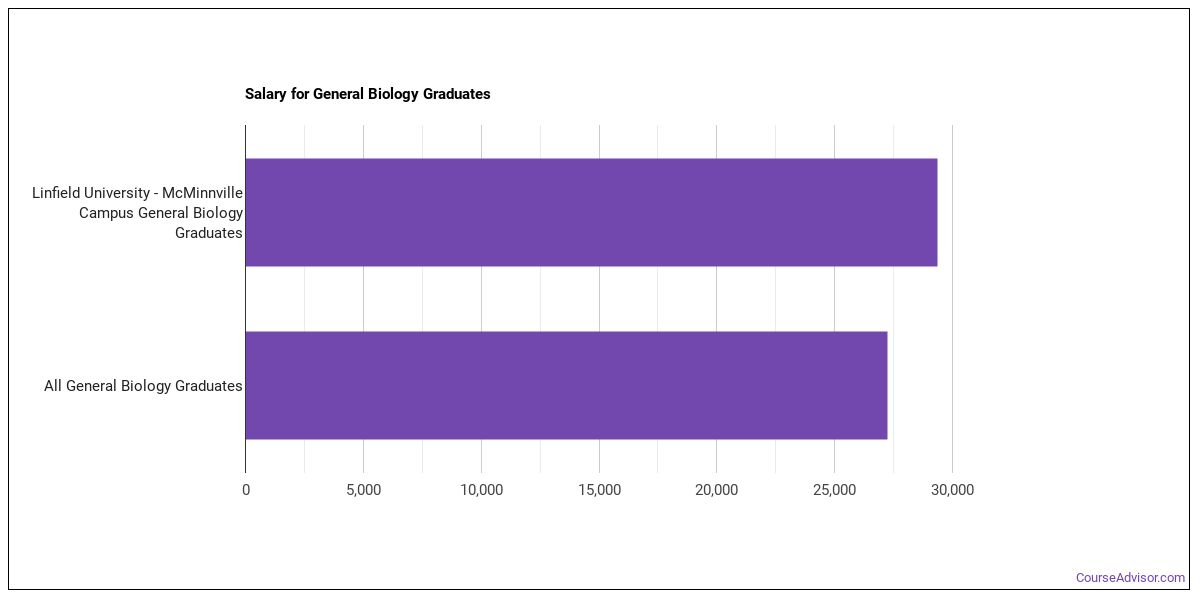
Earnings for General Biology Graduates from Linfield University
Those who finish Linfield University’s General Biology program earn the following amounts (per the U.S. Department of Education’s College Scorecard):
| Years After Graduation | Median Earnings |
|---|---|
| 1 year | $29,345 |
| 2 years | $28,598 |
| 5 years | $44,884 |
Median Debt at Graduation
The median debt for General Biology graduates from Linfield University comes in at $27,000.
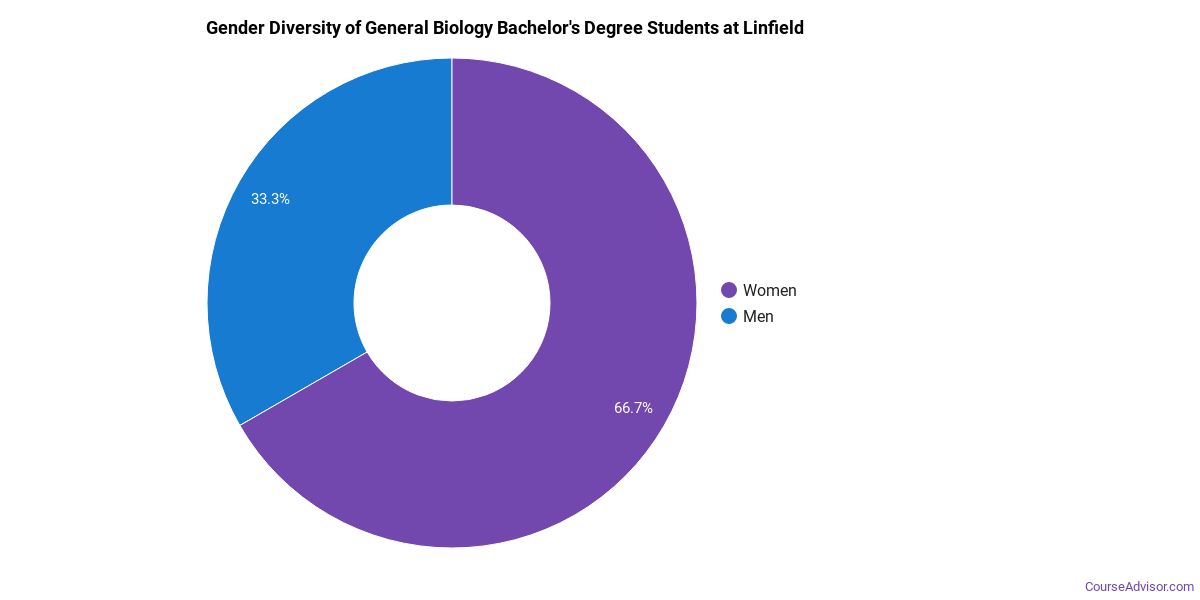
Student Demographics & Diversity
Take a look at the composition of General Biology graduates at Linfield University, broken down by degree level.
Looking at the program as a whole, General Biology graduates at Linfield University are 77% women (10) and 23% men (3).
General Biology Bachelor’s Program at Linfield University
Of the 13 bachelor’s general biology graduates at Linfield University, 77% were women (10) and 23% were men (3).
The following table and chart show the race/ethnicity of General Biology bachelor’s degree recipients at Linfield University.
| Race / Ethnicity | Number of Graduates |
|---|---|
| White | 5 |
| Hispanic / Latino | 5 |
| Asian | 1 |
| Two or More Races | 2 |
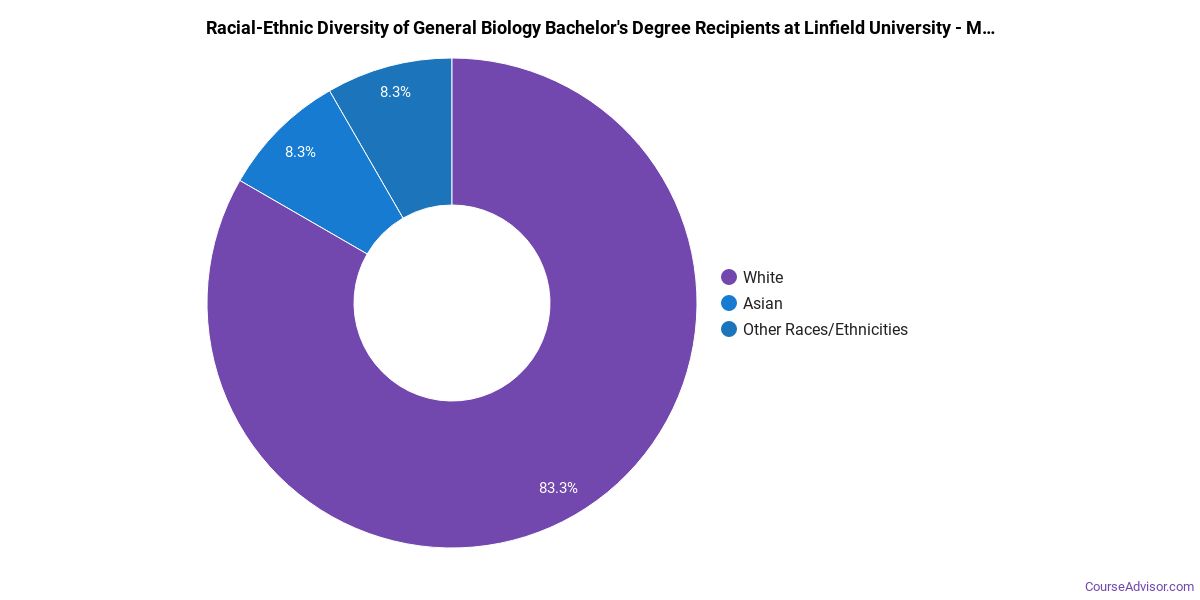
Minority students account for 62% of General Biology bachelor’s degree recipients at Linfield University, higher than the national average of 47%.*
*The racial-ethnic minorities figure is the total number of graduates minus White, international (nonresident), and unknown-race graduates.
More Specific General Biology Concentrations at Linfield University
This General Biology program at Linfield University includes the following sub-specializations:
| Concentration | Graduates |
|---|---|
| Biology Studies | 13 |
Highest-Paying Careers for General Biology Graduates
Those who complete General Biology program at Linfield University pursue many career paths. Here are the best-paid careers for General Biology graduates, ordered by median annual salary:
| Occupation | Nationwide Median Wage |
|---|---|
| Water Resource Specialists | $179,716 |
| Natural Sciences Managers | $132,227 |
| Medical Scientists, Except Epidemiologists | $111,314 |
| Clinical Research Coordinators | $110,931 |
| Food Science Technicians | $100,898 |
| Biological Technicians | $100,160 |
| Molecular and Cellular Biologists | $100,077 |
| Life Scientists, All Other | $97,541 |
| Bioinformatics Scientists | $92,484 |
| Forensic Science Technicians | $85,117 |
References
- IPEDS — Integrated Postsecondary Education Data System
- U.S. Department of Education — College Scorecard
- O*NET Online (Bureau of Labor Statistics)
- National Center for Education Statistics
More about our data sources and methodologies.
Course Advisor provides higher-education, college and university, degree, program, career, salary, and other helpful information to students, faculty, institutions, and other internet audiences. Presented information and data are subject to change. Inclusion on this website does not imply or represent a direct relationship with the company, school, or brand. Information, though believed correct at time of publication, may not be correct, and no warranty is provided. Contact the schools to verify any information before relying on it. Financial aid may be available for those who qualify. The displayed options may include sponsored or recommended results, not necessarily based on your preferences.
© Course Advisor – All Rights Reserved.