Linfield University Science & Tech Programs
Linfield University is a private not-for-profit institution located in McMinnville, OR. A Distant Town provides an ideal setting with access to urban amenities.
Featured schools near , edit
Linfield University Rankings
Linfield University appears in the following rankings for science & tech programs at the bachelors level:
| Ranking | Rank | Among |
|---|---|---|
| Overall Quality | #2 of 59 | State — Oregon |
| Overall Quality | #43 of 667 | Region — Far Western |
| Overall Quality | #195 of 4,630 | Nationwide |
Where Is Linfield University?
Contact information for Linfield University can be found below.
| Contact Details | |
|---|---|
| Address: | 900 SE Baker, McMinnville, OR 97128-6894 |
| Phone: | 5038832200 |
| Website: | www.linfield.edu/ |
| Admissions: | www.linfield.edu/admission/index.html |
| Financial Aid: | www.linfield.edu/financial-aid/index.html |
How Do I Get Into Linfield University?
You can apply to Linfield University online at: https://www.linfield.edu/admission/index.html
Linfield University is classified as Least Selective (85%+) for admissions.
Admission Requirements for Linfield University
These are the things Linfield University looks for in applicants:
| Requirement | Status |
|---|---|
| Secondary School Record | Required |
| Secondary School GPA | Required |
| Recommendations | Required |
| Admission Test Scores (SAT/ACT) | Neither required nor recommended |
How Hard Is It To Get Into Linfield University?
Linfield University admits 85%, making it highly accessible. Take time to make sure you submit all the requested materials and prepare the application in full.
Of those admitted, 17% choose to enroll — a modest enrollment yield, suggesting many admitted students choose other institutions.
Average Test Scores
Selectivity by Gender
Admit rates at Linfield University can differ by gender.
| Gender | Applicants | Admitted | Acceptance Rate |
|---|---|---|---|
| Men | 1,083 | 898 | 83% |
| Women | 1,544 | 1,339 | 87% |
Can I Afford Linfield University?
The average net price after aid at Linfield University is $27,341. Your actual cost will depend on your family’s circumstances since net price varies by income group.
Tuition & Fees
| Category | Cost |
|---|---|
| In-State Tuition | $50,324 |
| In-State Fees | $1,412 |
| Out-of-State Tuition | $50,324 |
| Out-of-State Fees | $1,412 |
| Total In-State Tuition & Fees | $51,736 |
| Total Out-of-State Tuition & Fees | $51,736 |
Financial Aid
Across all aid types, 21% of students at Linfield University receive some form of financial aid (345 students).
Approximately 95% of students at Linfield University receive grant or scholarship aid, averaging $31,493 per student.
30% of students receive federal Pell Grants, averaging $5,198.
Student Loan Debt
84% of Linfield University undergraduates take out federal student loans, averaging $7,143 per year.
Linfield University Undergraduate Student Diversity
There are 69 students enrolled at Linfield University. Linfield University is classified as a 1,000 - 4,999 institution by enrollment size. Its Carnegie Classification is Baccalaureate Colleges: Arts & Sciences Focus.
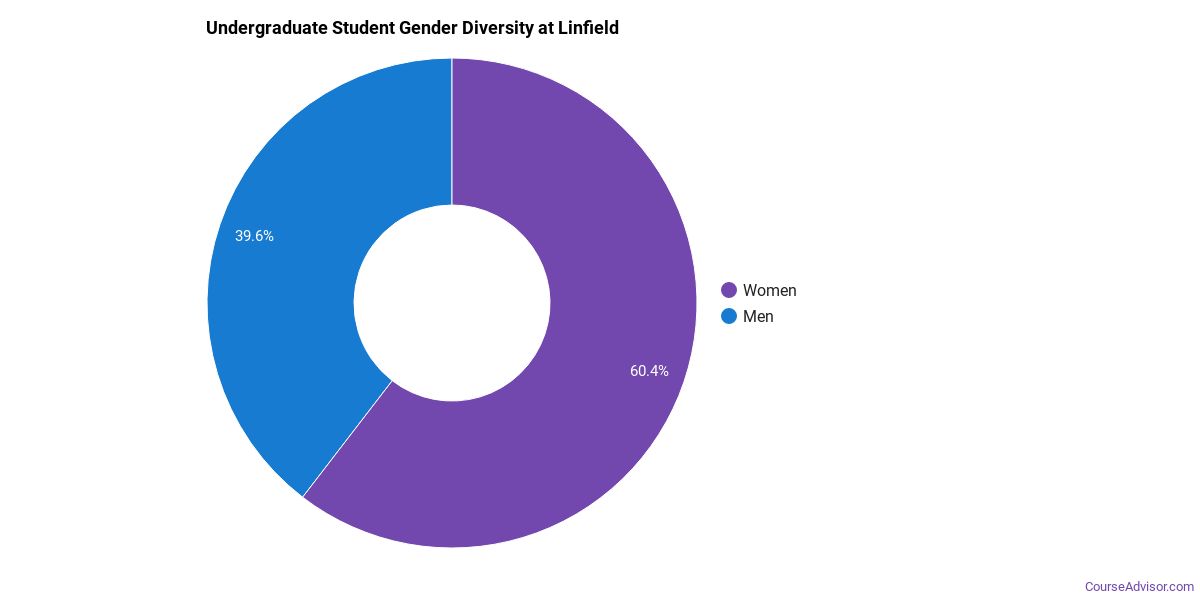
Gender Diversity
Of the 1,642 undergraduate students at Linfield University, approximately 35% are male and 65% are female.
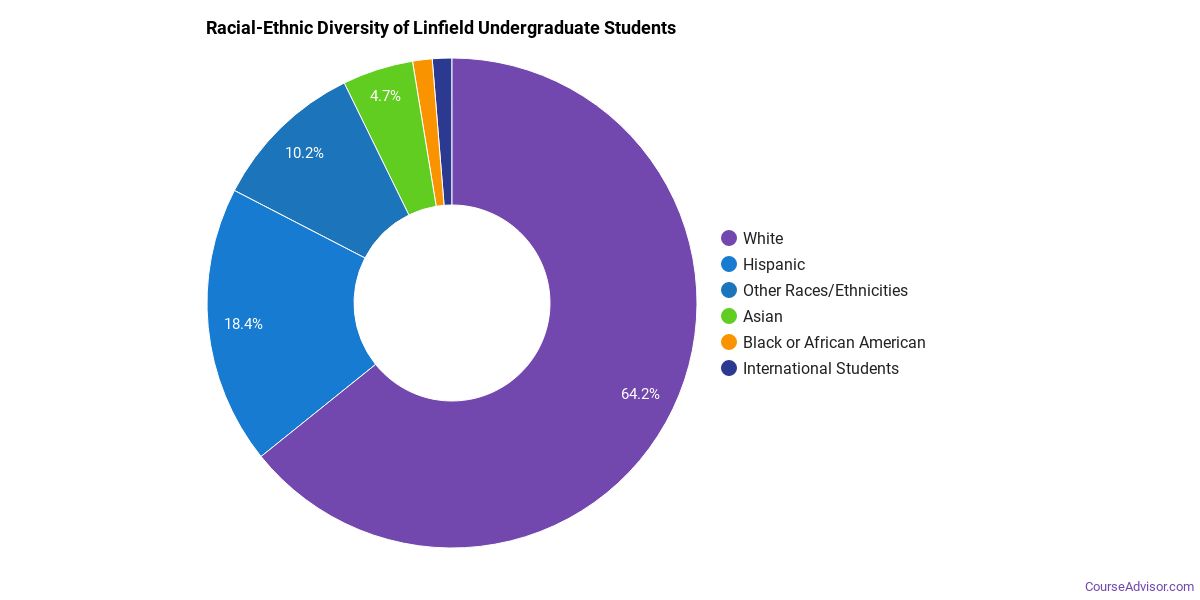
Racial-Ethnic Diversity
The racial-ethnic breakdown of Linfield University undergraduate students is as follows.
| Race/Ethnicity | Number of Students |
|---|---|
| Asian | 95 |
| Black or African American | 31 |
| Hispanic | 374 |
| White | 942 |
| American Indian/Alaska Native | 8 |
| Native Hawaiian/Pacific Islander | 13 |
| Two or More Races | 126 |
| Non-Resident | 21 |
Geographic Diversity
The top 5 home states of first-time undergraduate students at Linfield University are shown below.

| State | First-Time UG Students |
|---|---|
| Oregon | 238 |
| Washington | 48 |
| California | 36 |
| Hawaii | 19 |
| Alaska | 10 |
Additionally, approximately 1.3% of undergraduate students are non-resident from outside the United States.
Linfield University Graduate Student Diversity
48 of Linfield University’s students are in graduate programs. The highest graduate-level award offered is Master’s degree.
Gender Diversity (Graduate)
Among graduate students at Linfield University, approximately 44% are male and 56% are female.

Racial-Ethnic Diversity (Graduate)
The racial-ethnic breakdown of Linfield University graduate students is as follows.

| Race/Ethnicity | Number of Students |
|---|---|
| Asian | 0 |
| Black or African American | 1 |
| Hispanic | 3 |
| White | 27 |
| Two or More Races | 4 |
| Non-Resident | 0 |
Online Learning at Linfield University
Linfield University delivers online programs for students who need flexibility.
286 undergraduate students at Linfield University took at least one online class — of those, 104 took all of their classes online.
At the graduate level, 0 students took at least one online class and 1 took all classes online. Distance education is available at the undergraduate and graduate levels.
Academic Programs at Linfield University
Linfield University offers 25 distinct academic programs.
The highest level of award offered is Master’s degree.
Institutional Profile
Linfield University has an open admission policy: No. Credit transfer:
- AP credits: Yes
- Dual enrollment credits: Yes
- Life experience credits: Implied no
References
More about our data sources and methodologies.
Course Advisor provides higher-education, college and university, degree, program, career, salary, and other helpful information to students, faculty, institutions, and other internet audiences. Presented information and data are subject to change. Inclusion on this website does not imply or represent a direct relationship with the company, school, or brand. Information, though believed correct at time of publication, may not be correct, and no warranty is provided. Contact the schools to verify any information before relying on it. Financial aid may be available for those who qualify. The displayed options may include sponsored or recommended results, not necessarily based on your preferences.
© Course Advisor – All Rights Reserved.