Finance at Arizona State University Campus Immersion
If you are interested in studying Finance, take a look at what Arizona State University Campus Immersion. Get started with the following essential facts.
Arizona State University Campus Immersion sits in Tempe, AZ.
During the most recent reporting year, 427 finance graduations were recorded at Arizona State University Campus Immersion.
Featured schools near , edit
Studying Online at Arizona State University Campus Immersion
Online coursework is an option at Arizona State University Campus Immersion. Of 79,818 students, 3,837 (5%) studied exclusively online and 42,409 (53%) took at least some classes online.
Student Demographics & Diversity
The following sections describe the diversity of Finance graduates at Arizona State University Campus Immersion, by degree type.
Looking at the program as a whole, Finance graduates at Arizona State University Campus Immersion are 24% women (104) and 76% men (323).
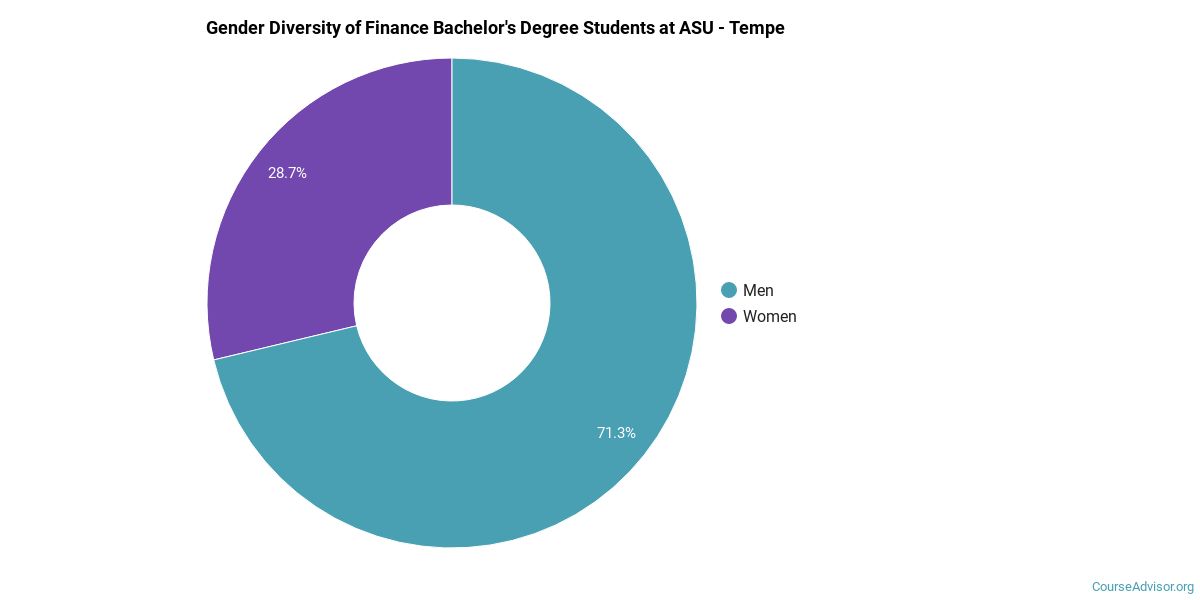
Finance Bachelor’s Program at Arizona State University Campus Immersion
Among the 427 bachelor’s finance degrees awarded at Arizona State University Campus Immersion, 24% were women (104) and 76% were men (323).
The following table and chart show the race/ethnicity of Finance bachelor’s degree recipients at Arizona State University Campus Immersion.
| Race / Ethnicity | Number of Graduates |
|---|---|
| White | 230 |
| Hispanic / Latino | 72 |
| Black / African American | 6 |
| Asian | 33 |
| Two or More Races | 18 |
| International (Nonresident) | 52 |
| Unknown | 16 |

Racial-ethnic minorities make up 30% of Finance bachelor’s degree recipients at Arizona State University Campus Immersion, higher than the national average of 29%.*
*The racial-ethnic minorities figure is the total number of graduates minus White, international (nonresident), and unknown-race graduates.
Best-Paid Careers for Finance Graduates
Graduates of the Finance program at Arizona State University Campus Immersion pursue many career paths. The table below ranks the best-paid careers for Finance majors, ordered by median annual salary:
| Occupation | Nationwide Median Wage |
|---|---|
| Treasurers and Controllers | $162,461 |
| Investment Fund Managers | $157,819 |
| General and Operations Managers | $149,694 |
| Chief Executives | $138,534 |
| Financial Risk Specialists | $127,364 |
| Financial Quantitative Analysts | $126,371 |
| Appraisers of Personal and Business Property | $118,242 |
| Chief Sustainability Officers | $96,628 |
| Fraud Examiners, Investigators and Analysts | $92,240 |
| Personal Financial Advisors | $91,777 |
References
- IPEDS — Integrated Postsecondary Education Data System
- U.S. Department of Education — College Scorecard
- O*NET Online (Bureau of Labor Statistics)
- National Center for Education Statistics
More about our data sources and methodologies.
Course Advisor provides higher-education, college and university, degree, program, career, salary, and other helpful information to students, faculty, institutions, and other internet audiences. Presented information and data are subject to change. Inclusion on this website does not imply or represent a direct relationship with the company, school, or brand. Information, though believed correct at time of publication, may not be correct, and no warranty is provided. Contact the schools to verify any information before relying on it. Financial aid may be available for those who qualify. The displayed options may include sponsored or recommended results, not necessarily based on your preferences.
© Course Advisor – All Rights Reserved.