Business, Management & Marketing Schools in Delaware
In 2020-2021, 3,125 students earned their Business, Management & Marketing degrees in DE.
In this state, Business, Management & Marketing is the 1st most popular major out of a total 33 majors commonly available.
Featured schools near , edit
Education Levels of Business, Management & Marketing Majors in Delaware
Business, Management & Marketing majors in the state tend to have the following degree levels:
| Education Level | Number of Grads |
|---|---|
| Bachelor’s Degree | 1,599 |
| Master’s Degree | 1,211 |
| Associate Degree | 253 |
| Doctor’s Degree (Professional Practice) | 44 |
| Doctor’s Degree (Research / Scholarship) | 44 |
| Doctor’s Degree (Other) | 44 |
| Award Taking Less Than 1 Year | 16 |
| Award Taking 12 Weeks to 1 Year | 16 |
| Award Taking Less 12 Weeks | 16 |
| Post-Master’s Certificate | 2 |
| Postbaccalaureate Certificate | 2 |
Gender Distribution
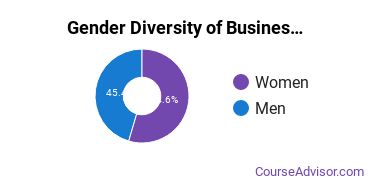
In Delaware, a business, management and marketing major is more popular with women than with men.

Racial Distribution
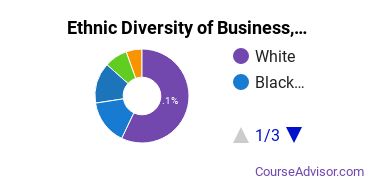
The racial distribution of business, management and marketing majors in Delaware is as follows:
- Asian: 4.3%
- Black or African American: 14.8%
- Hispanic or Latino: 7.6%
- White: 54.6%
- Non-Resident Alien: 13.4%
- Other Races: 5.2%

Jobs for Business, Management & Marketing Grads in Delaware
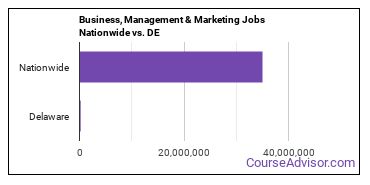
In this state, there are 108,750 people employed in jobs related to a business, management and marketing degree, compared to 34,973,960 nationwide.

Wages for Business, Management & Marketing Jobs in Delaware
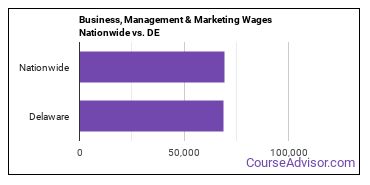
A typical salary for a business, management and marketing grad in the state is $68,690, compared to a typical salary of $69,480 nationwide.

Most Popular Business, Management & Marketing Programs in DE
There are 7 colleges in Delaware that offer business, management and marketing degrees. Learn about the most popular 7 below:
89% of students get financical aid. The 2.10% student loan default rate is lower than average. 15 to 1 is the student to faculty ratio.
The student loan default rate is 6.50% which is lower than average. The average student takes 4.56 years to complete their degree at Wilmington University. Of all the teachers who work at the school, 7% are considered full time.
Of all the teachers who work at the school, 28% are considered full time. Students enjoy a student to faculty ratio of 19 to 1. It takes the average student 4.08 years to graduate.
The student to faculty ratio is 13 to 1. The 9.10% student loan default rate is lower than average. This public school has an average net price of $8,479.
Of all the teachers who work at the school, 64% are considered full time. Students who attend this public school pay an average net price of $14,866. Seeking financial aid? At this school, 97% of students receive it.
12% of the teachers are full time. Roughly six years after entering college, graduates of this school earn $30,628 a year. The student loan default rate of 8.60% is a good sign that graduates can afford their loan payments.
Seeking financial aid? At this school, 100% of students receive it. Students enjoy a student to faculty ratio of 9 to 1. In their early career, Wesley College grads earn an average salary of $34,960.
Business, Management & Marketing Careers in DE
Some of the careers business, management and marketing majors go into include:
Explore Major by State
Alabama
Arkansas
Connecticut
Florida
Idaho
Iowa
Louisiana
Massachusetts
Mississippi
Nebraska
New Jersey
North Carolina
Oklahoma
Rhode Island
Tennessee
Vermont
West Virginia
View Nationwide Business, Management & Marketing Report
References
- College Factual
- National Center for Education Statistics
- O*NET Online
- Image Credit: By Amit Savargaonkar under License
More about our data sources and methodologies.
Featured Schools
 Request Info
|
Southern New Hampshire University You have goals. Southern New Hampshire University can help you get there. Whether you need a bachelor's degree to get into a career or want a master's degree to move up in your current career, SNHU has an online program for you. Find your degree from over 200 online programs. Learn More > |


