Find Schools

Study Area & Zipcode

Business, Management & Marketing in Missouri

Find Schools Near

Business, Management & Marketing Schools in Missouri

15,810 Business, Management & Marketing students earned their degrees in the state in 2020-2021.

As a degree choice, Business, Management & Marketing is the 2nd most popular major in the state.

Education Levels of Business, Management & Marketing Majors in Missouri

Business, Management & Marketing majors in the state tend to have the following degree levels:

Education Level Number of Grads
Bachelor’s Degree 8,176
Master’s Degree 5,484
Associate Degree 917
Postbaccalaureate Certificate 663
Post-Master’s Certificate 663
Award Taking 12 Weeks to 1 Year 373
Award Taking Less Than 1 Year 373
Award Taking Less 12 Weeks 373
Award Taking 2 to 4 Years 164
Award Taking 1 to 2 Years 164
Doctor’s Degree (Professional Practice) 33
Doctor’s Degree (Other) 33
Doctor’s Degree (Research / Scholarship) 33

Gender Distribution

In Missouri, a business, management and marketing major is more popular with men than with women.

undefined

Racial Distribution

The racial distribution of business, management and marketing majors in Missouri is as follows:

  • Asian: 3.5%
  • Black or African American: 12.2%
  • Hispanic or Latino: 6.7%
  • White: 61.8%
  • Non-Resident Alien: 9.5%
  • Other Races: 6.3%
undefined

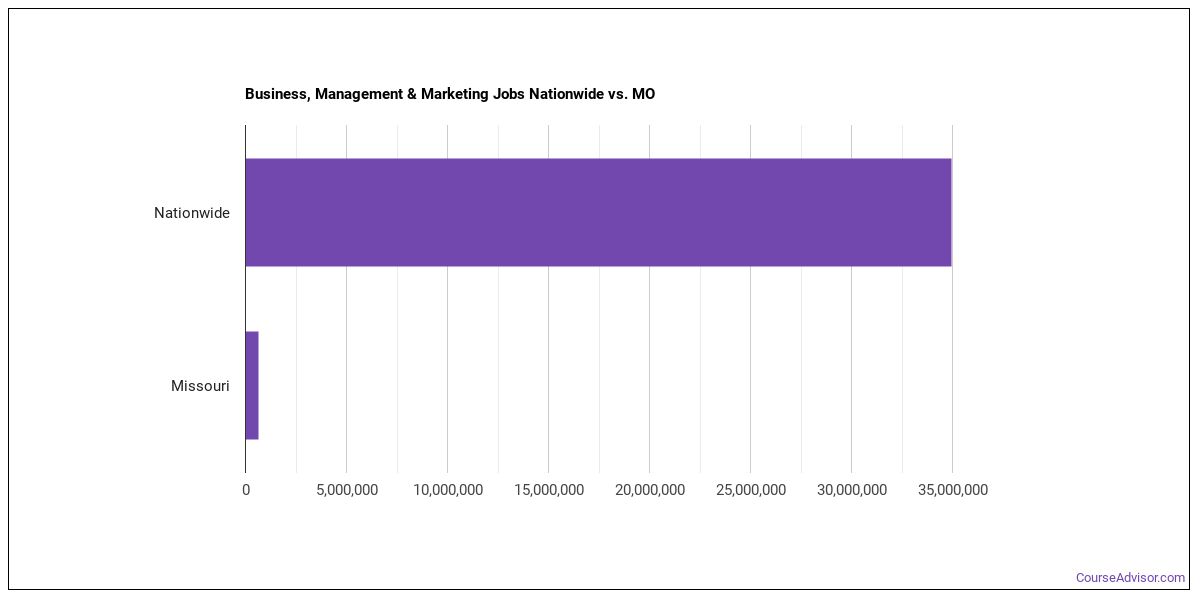
Jobs for Business, Management & Marketing Grads in Missouri

There are 646,340 people in the state and 34,973,960 people in the nation working in business, management and marketing jobs.

undefined

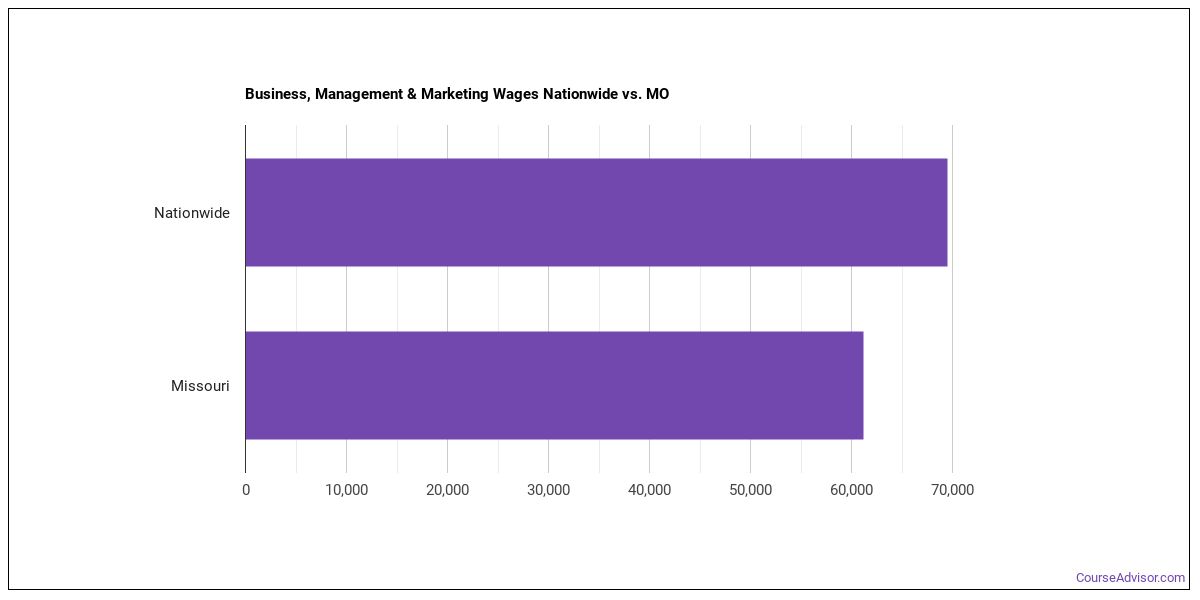
Wages for Business, Management & Marketing Jobs in Missouri

In this state, business, management and marketing grads earn an average of $61,210. Nationwide, they make an average of $69,480.

undefined

There are 10 colleges in Missouri that offer business, management and marketing degrees. Learn about the most popular 10 below:

#1

Webster University

Saint Louis
2,038 Degrees in Major Awarded
59% Graduation Rate
8,197 Total Students

This school boasts a lower than average student loan default rate of 3.90%. 98% of students are awarded financial aid at this school. It takes the average student 4.41 years to graduate.

1,428 Degrees in Major Awarded
69% Graduation Rate
31,089 Total Students

A typical student attending Mizzou will pay a net price of $16,559. Of all the students who attend this school, 93% get financial aid. 73% of the teachers are full time.

1,371 Degrees in Major Awarded
54% Graduation Rate
23,505 Total Students

Students enjoy a student to faculty ratio of 20 to 1. Roughly six years after entering college, graduates of this school earn $37,811 a year. This school boasts a lower than average student loan default rate of 3.90%.

#4

Park University

Parkville
1,228 Degrees in Major Awarded
35% Graduation Rate
10,165 Total Students

The student to faculty ratio is 15 to 1. Roughly six years after entering college, graduates of this school earn $44,444 a year. The student loan default rate is 7.00% which is lower than average.

#5

Columbia College

Columbia
1,108 Degrees in Major Awarded
25% Graduation Rate
8,347 Total Students

The 8.90% student loan default rate is lower than average. Most students complete their degree in 4.40 years. Students who attend this private institution pay an average net price of $26,668.

1,050 Degrees in Major Awarded
95% Graduation Rate
15,449 Total Students

54% of students are awarded financial aid at this school. The student loan default rate of 1.10% is a good sign that graduates can afford their loan payments. 71% of the teachers are full time.

680 Degrees in Major Awarded
52% Graduation Rate
13,874 Total Students

Grads earn an average early-career salary of $41,078 after earning their degree at this institution. 96% of students are awarded financial aid at this school. A typical student attending UMSL will pay a net price of $12,232.

666 Degrees in Major Awarded
48% Graduation Rate
16,147 Total Students

69% of the teachers are full time. Graduates earn an average $43,346 after graduation. This public college charges it's students an average net price of $15,702.

#9

Lindenwood University

Saint Charles
573 Degrees in Major Awarded
50% Graduation Rate
7,382 Total Students

The student to faculty ratio is 14 to 1. Students who attend this private institution pay an average net price of $17,366. The average student takes 4.40 years to complete their degree at Lindenwood University.

511 Degrees in Major Awarded
72% Graduation Rate
10,979 Total Students

15% of the teachers are full time. Graduates earn an average $47,446 after graduation. Seeking financial aid? At this school, 99% of students receive it.

Business, Management & Marketing Careers in MO

Some of the careers business, management and marketing majors go into include:

Job Title MO Job Growth MO Median Salary
Statisticians 35% $65,380
Actuaries 25% $84,500
Business Professors 25% $80,690
Market Research Analysts and Marketing Specialists 25% $56,710
Operations Research Analysts 24% $72,020
Demonstrators and Product Promoters 22% $29,500
Brokerage Clerks 21% $44,290
Survey Researchers 21% $50,130
Natural Sciences Managers 21% $104,550
Financial Managers 20% $121,860
Cargo and Freight Agents 20% $44,380
Technical Writers 19% $56,250
Real Estate Appraisers 19% $50,830
Computer and Information Systems Managers 18% $125,790
Economics Professors 18% $96,970
Personal Financial Advisors 17% $63,000
Mathematical Science Professors 17% $76,650
Economists 17% $91,350
Insurance Claims and Policy Processing Clerks 16% $36,010
Social and Community Service Managers 16% $56,540
Training and Development Managers 15% $104,860
Meeting, Convention, and Event Planners 15% $42,390
Training and Development Specialists 15% $56,440
Management Analysts 14% $76,230
Marketing Managers 14% $121,990
Securities, Commodities, and Financial Services Sales Agents 14% $56,390
Insurance Sales Agents 13% $45,990
Statistical Assistants 13% $44,010
Construction Managers 13% $89,730
Financial Examiners 13% $66,240
Financial Analysts 12% $81,990
Cost Estimators 11% $63,570
Administrative Services Managers 11% $86,940
Managers 10% $93,580
Human Resources Managers 10% $106,570
General and Operations Managers 10% $81,500
Loan Officers 9% $68,010
Human Resources Specialists 9% $55,700
Property, Real Estate, and Community Association Managers 9% $44,140
Compensation, Benefits, and Job Analysis Specialists 9% $58,900
Food Service Managers 9% $48,560
Loan Interviewers and Clerks 9% $36,830
Writers and Authors 8% $55,250
Production, Planning, and Expediting Clerks 8% $47,380
Real Estate Sales Agents 8% $48,920
Sales Managers 7% $123,760
Compensation and Benefits Managers 7% $119,560
Budget Analysts 7% $63,870
Logisticians 7% $68,490
Credit Analysts 7% $64,290
Wholesale Scientific Products Sales Representatives 7% $74,590
Sales Representatives 7% $46,480
Real Estate Brokers 7% $36,180
Accountants and Auditors 6% $63,640
Transportation, Storage, and Distribution Managers 6% $92,470
Purchasing Managers 6% $123,840
Mechanic, and Repairer Supervisors 5% $59,650
Customer Service Representatives 5% $33,060
Retail Sales Supervisors 5% $38,490
Advertising and Promotions Managers 5% $114,560
Office and Administrative Support Worker Supervisors 4% $54,180
Parts Salespersons 4% $30,230
Sales Supervisors 4% $70,620
Receptionists and Information Clerks 3% $26,780
Wholesale and Manufacturing Sales Representatives 3% $56,890
Production and Operating Worker Supervisors 3% $56,100
Dispatchers 2% $40,540
Industrial Production Managers 2% $97,310
Claims Adjusters, Examiners, and Investigators 1% $65,310
Office Clerks 0% $29,870
Lodging Managers 0% $45,420
Payroll and Timekeeping Clerks -2% $38,350
Bookkeeping, Accounting, and Auditing Clerks -3% $36,780
Computer Programmers -3% $76,140
Insurance Underwriters -3% $64,660
Chief Executives -3% $144,070
Advertising Sales Agents -3% $42,080
Editors -4% $47,460
Credit Authorizers, Checkers, and Clerks -4% $34,750
Wholesale and Retail Buyers -5% $0
Tax Examiners, Collectors, and Revenue Agents -5% $43,690
Slot Supervisors -6% $0
Procurement Clerks -6% $40,810
Tellers -6% $26,670
Secretaries and Administrative Assistants -6% $33,750
Purchasing Agents -6% $0
Gaming Supervisors -7% $0
Bill and Account Collectors -7% $34,040
Labor Relations Specialists -8% $59,140
Travel Agents -11% $31,130
Executive Secretaries and Executive Administrative Assistants -16% $56,220
Data Entry Keyers -20% $31,480
Word Processors and Typists -33% $32,930

View Nationwide Business, Management & Marketing Report

References

More about our data sources and methodologies.

Featured Schools

Find Schools Near You

Our free school finder matches students with accredited colleges across the U.S.