Business Administration & Management at Webster University
If you are interested in studying Business Administration & Management, take a look at what Webster University. The following information will help you decide if it is a good fit for you.
Webster University is in Saint Louis, MO.
For the most recent IPEDS reporting year, 525 business administration & management degrees were granted at Webster University.
Featured schools near , edit
Online Class Availability at Webster University
Online coursework is an option at Webster University. Among 8,260 students, 2,273 (28%) studied exclusively online and 3,050 (37%) took at least some classes online.
Student Demographics & Diversity
The following sections describe the student demographics for Business Administration & Management graduates at Webster University, by degree type.
Looking at the program as a whole, Business Administration & Management graduates at Webster University are 49% women (257) and 51% men (268).
Business Administration & Management Bachelor’s Program at Webster University
Of the 75 bachelor’s business administration & management graduates at Webster University, 41% were women (31) and 59% were men (44).

The following table and chart show the race/ethnicity of Business Administration & Management bachelor’s degree recipients at Webster University.
| Race / Ethnicity | Number of Graduates |
|---|---|
| White | 37 |
| Hispanic / Latino | 3 |
| Black / African American | 15 |
| Asian | 3 |
| Two or More Races | 1 |
| International (Nonresident) | 10 |
| Unknown | 6 |

Minority students account for 29% of Business Administration & Management bachelor’s degree recipients at Webster University, lower than the national average of 42%.*
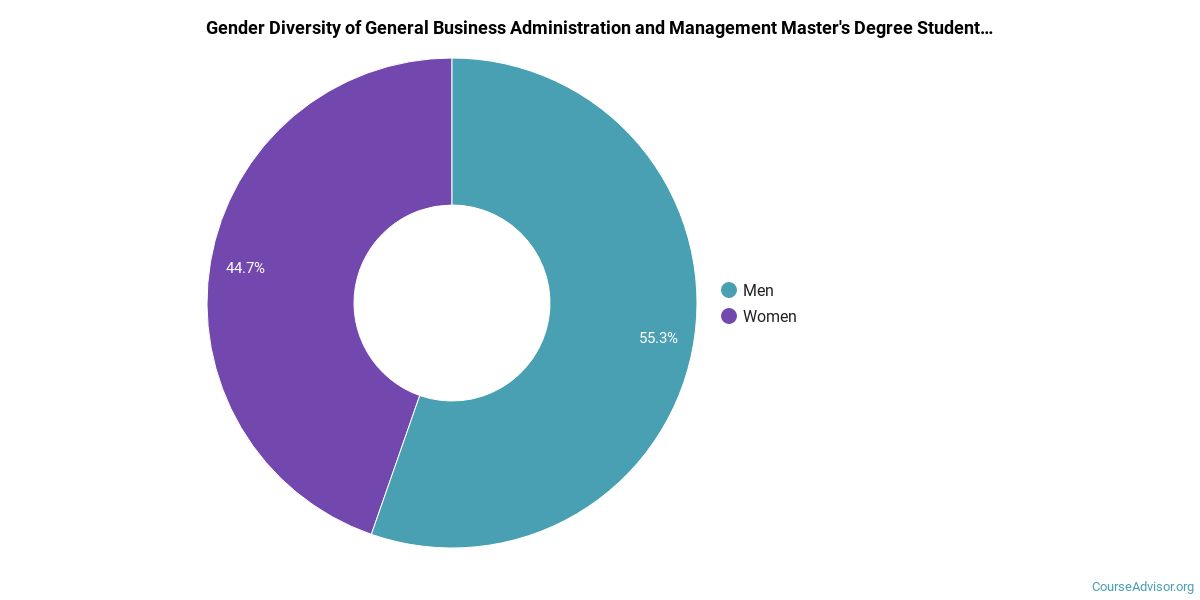
Business Administration & Management Master’s Program at Webster University
Among the 448 master’s business administration & management graduates at Webster University, 50% were women (225) and 50% were men (223).
The following table and chart show the race/ethnicity of Business Administration & Management master’s degree recipients at Webster University.
| Race / Ethnicity | Number of Graduates |
|---|---|
| White | 219 |
| Hispanic / Latino | 33 |
| Black / African American | 121 |
| Asian | 19 |
| Native Hawaiian / Pacific Islander | 1 |
| Two or More Races | 13 |
| International (Nonresident) | 27 |
| Unknown | 15 |

Minority students account for 42% of Business Administration & Management master’s degree recipients at Webster University, higher than the national average of 36%.*
Business Administration & Management Doctoral Program at Webster University
Among the 2 doctoral business administration & management degrees awarded at Webster University, 50% were women (1) and 50% were men (1).

The following table and chart show the race/ethnicity of Business Administration & Management doctoral degree recipients at Webster University.
| Race / Ethnicity | Number of Graduates |
|---|---|
| Black / African American | 1 |
| Asian | 1 |

Minority students account for 100% of Business Administration & Management doctoral degree recipients at Webster University, above the national average of 38%.*
*The racial-ethnic minorities figure is the total number of graduates minus White, international (nonresident), and unknown-race graduates.
Highest-Paying Careers for Business Administration & Management Graduates
Students who finish Business Administration & Management program at Webster University go on to a range of careers. The table below ranks the top-paying careers for Business Administration & Management majors, ordered by median annual salary:
| Occupation | Nationwide Median Wage |
|---|---|
| Personal Service Managers, All Other | $176,674 |
| Loss Prevention Managers | $165,723 |
| Geothermal Production Managers | $160,381 |
| Administrative Services Managers | $158,084 |
| Facilities Managers | $157,669 |
| Biomass Power Plant Managers | $146,025 |
| Training and Development Managers | $139,524 |
| Chief Executives | $138,534 |
| Supply Chain Managers | $138,103 |
| Security Management Specialists | $128,654 |
References
- IPEDS — Integrated Postsecondary Education Data System
- U.S. Department of Education — College Scorecard
- O*NET Online (Bureau of Labor Statistics)
- National Center for Education Statistics
More about our data sources and methodologies.
Course Advisor provides higher-education, college and university, degree, program, career, salary, and other helpful information to students, faculty, institutions, and other internet audiences. Presented information and data are subject to change. Inclusion on this website does not imply or represent a direct relationship with the company, school, or brand. Information, though believed correct at time of publication, may not be correct, and no warranty is provided. Contact the schools to verify any information before relying on it. Financial aid may be available for those who qualify. The displayed options may include sponsored or recommended results, not necessarily based on your preferences.
© Course Advisor – All Rights Reserved.