Chemical Engineering at University of California-Los Angeles
What traits are you looking for in a school for Chemical Engineering, consider the program at University of California-Los Angeles. We’ve gathered the following information to help you decide.
University of California-Los Angeles is located in Los Angeles, CA.
For the most recent IPEDS reporting year, 99 chemical engineering graduations were recorded at University of California-Los Angeles.
Featured schools near , edit
Online Class Availability at University of California-Los Angeles
Online coursework is an option at University of California-Los Angeles. Of 47,335 students, 785 (2%) were enrolled entirely in distance education and 5,535 (12%) took at least some classes online.
Chemical Engineering Rankings at University of California-Los Angeles
Rankings can help you compare University of California-Los Angeles’s Chemical Engineering program against peer institutions.
Bachelor’s-Level Rankings
| Ranking | Scope | Rank |
|---|---|---|
| Best Schools (Quality) | California | #2 of 13 |
| Best Schools (Quality) | Far Western (Region) | #2 of 17 |
| Best Value | California | #9 of 13 |
| Best Value | Far Western (Region) | #10 of 17 |
| Best Schools (Quality) | Nationwide | #12 of 159 |
| Best Value | Nationwide | #20 of 159 |
Master’s-Level Rankings
| Ranking | Scope | Rank |
|---|---|---|
| Best Schools (Quality) | California | #2 of 13 |
| Best Schools (Quality) | Far Western (Region) | #2 of 17 |
| Best Value | California | #9 of 13 |
| Best Value | Far Western (Region) | #10 of 17 |
| Best Schools (Quality) | Nationwide | #12 of 159 |
| Best Value | Nationwide | #20 of 159 |
Doctoral-Level Rankings
| Ranking | Scope | Rank |
|---|---|---|
| Best Schools (Quality) | California | #2 of 13 |
| Best Schools (Quality) | Far Western (Region) | #2 of 17 |
| Best Value | California | #9 of 13 |
| Best Value | Far Western (Region) | #10 of 17 |
| Best Schools (Quality) | Nationwide | #12 of 159 |
| Best Value | Nationwide | #20 of 159 |
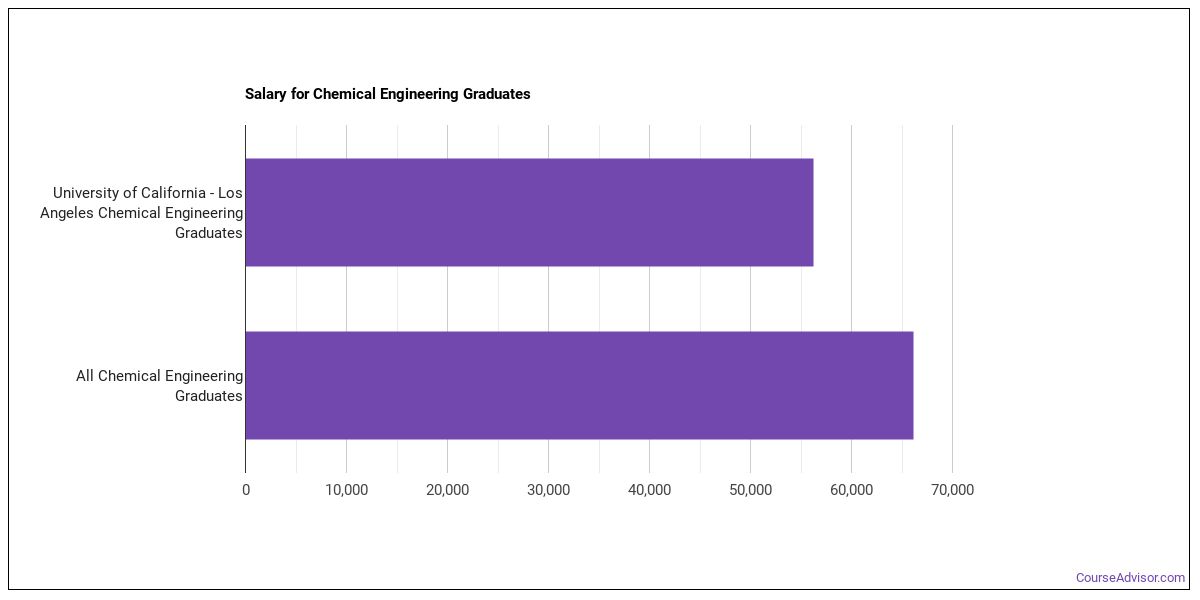
Earnings for Chemical Engineering Graduates from University of California-Los Angeles
Those who finish University of California-Los Angeles’s Chemical Engineering program report the following median earnings (per the U.S. Department of Education’s College Scorecard):
| Years After Graduation | Median Earnings |
|---|---|
| 1 year | $56,206 |
| 2 years | $63,005 |
| 3 years | $79,621 |
| 4 years | $92,741 |
| 5 years | $105,166 |
How does this compare to the school overall? Four years out, Chemical Engineering graduates from University of California-Los Angeles earn a median of $92,741, compared with $79,139 for all University of California-Los Angeles graduates — about 17% higher than the school-wide median.

Median Debt at Graduation
Typical debt at graduation for Chemical Engineering graduates from University of California-Los Angeles comes in at $18,205.
Student Demographics & Diversity
The following sections describe the diversity of Chemical Engineering graduates at University of California-Los Angeles, by degree type.
Looking at the program as a whole, Chemical Engineering graduates at University of California-Los Angeles are 39% women (39) and 61% men (60).
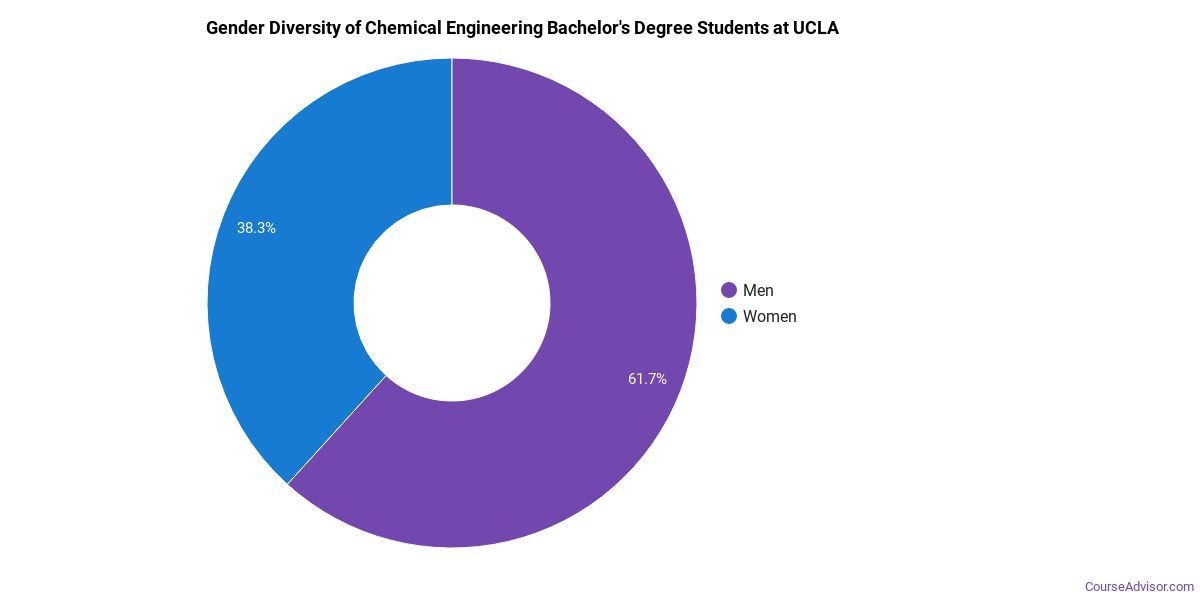
Chemical Engineering Bachelor’s Program at University of California-Los Angeles
Among the 67 bachelor’s chemical engineering degrees awarded at University of California-Los Angeles, 45% were women (30) and 55% were men (37).
The following table and chart show the race/ethnicity of Chemical Engineering bachelor’s degree recipients at University of California-Los Angeles.
| Race / Ethnicity | Number of Graduates |
|---|---|
| White | 14 |
| Hispanic / Latino | 7 |
| Black / African American | 1 |
| Asian | 28 |
| Two or More Races | 4 |
| International (Nonresident) | 11 |
| Unknown | 2 |
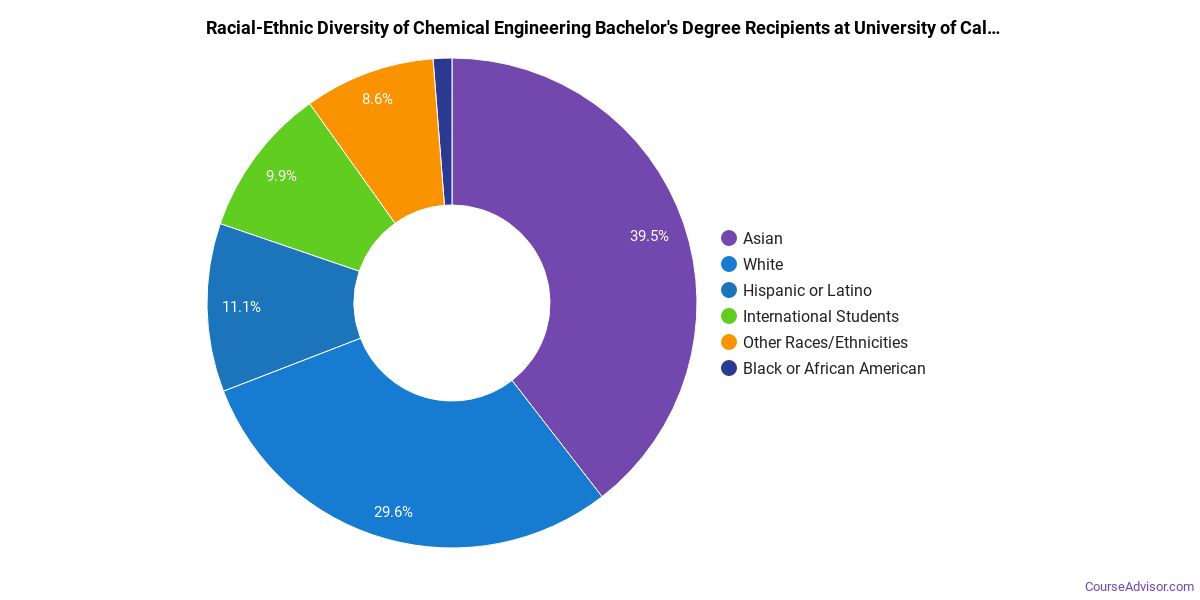
Minority students account for 60% of Chemical Engineering bachelor’s degree recipients at University of California-Los Angeles, higher than the national average of 34%.*
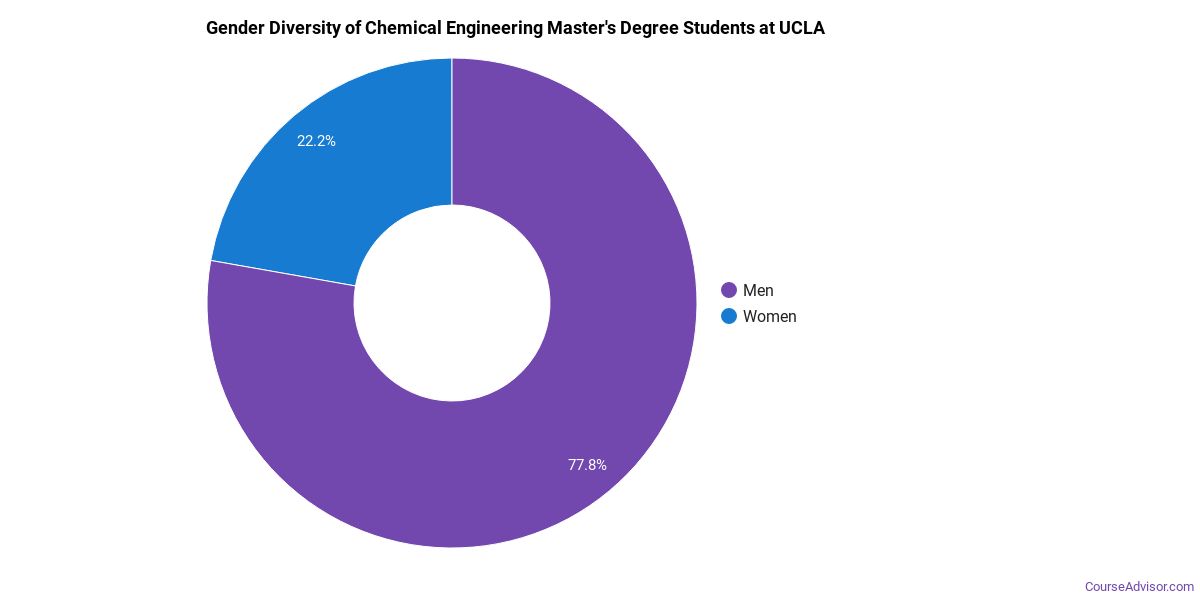
Chemical Engineering Master’s Program at University of California-Los Angeles
Of the 16 master’s chemical engineering degrees awarded at University of California-Los Angeles, 38% were women (6) and 62% were men (10).
The following table and chart show the race/ethnicity of Chemical Engineering master’s degree recipients at University of California-Los Angeles.
| Race / Ethnicity | Number of Graduates |
|---|---|
| White | 3 |
| Hispanic / Latino | 1 |
| Asian | 2 |
| Two or More Races | 1 |
| International (Nonresident) | 9 |
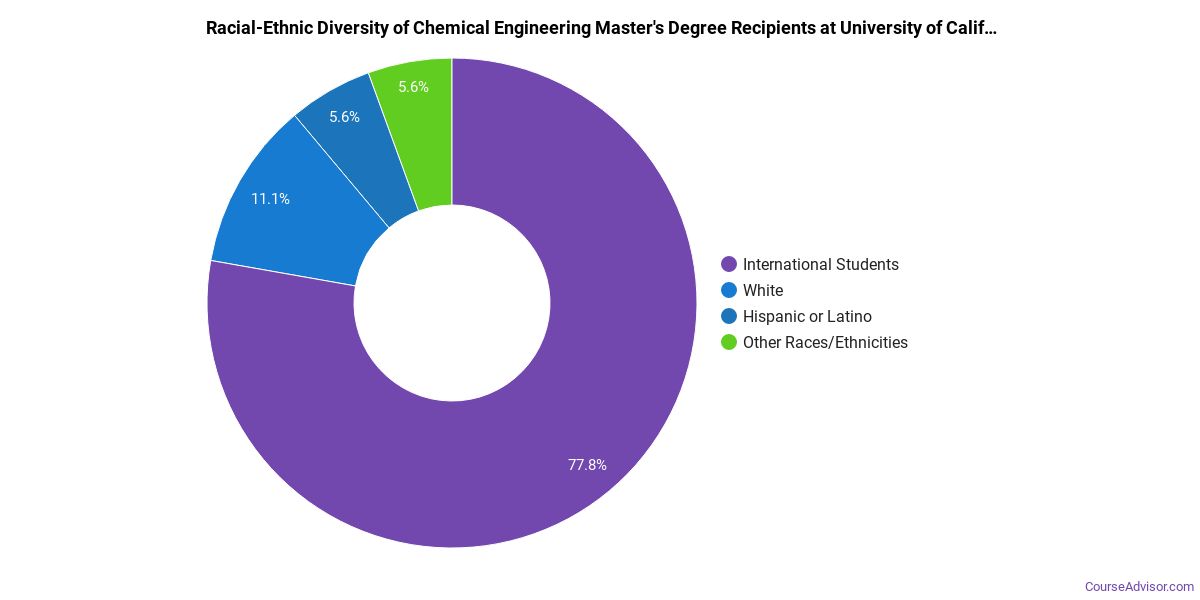
Racial-ethnic minorities make up 25% of Chemical Engineering master’s degree recipients at University of California-Los Angeles, higher than the national average of 22%.*
Chemical Engineering Doctoral Program at University of California-Los Angeles
Among the 16 doctoral chemical engineering degrees awarded at University of California-Los Angeles, 19% were women (3) and 81% were men (13).

The following table and chart show the race/ethnicity of Chemical Engineering doctoral degree recipients at University of California-Los Angeles.
| Race / Ethnicity | Number of Graduates |
|---|---|
| Hispanic / Latino | 1 |
| Black / African American | 1 |
| Asian | 1 |
| International (Nonresident) | 12 |
| Unknown | 1 |

Racial-ethnic minorities make up 19% of Chemical Engineering doctoral degree recipients at University of California-Los Angeles, higher than the national average of 16%.*
*The racial-ethnic minorities figure is the total number of graduates minus White, international (nonresident), and unknown-race graduates.
More Specific Chemical Engineering Concentrations at University of California-Los Angeles
This Chemical Engineering program at University of California-Los Angeles offers more specialized concentrations:
| Concentration | Graduates |
|---|---|
| General Chemical Engineering | 99 |
Highest-Paying Careers for Chemical Engineering Graduates
Those who complete Chemical Engineering program at University of California-Los Angeles go on to a range of careers. Here are the top-paying careers for Chemical Engineering majors, ordered by median annual salary:
| Occupation | Nationwide Median Wage |
|---|---|
| Engineers, All Other | $136,628 |
| Chemical Engineers | $130,903 |
| Bioengineers and Biomedical Engineers | $121,651 |
| Solar Energy Systems Engineers | $116,775 |
| Mechatronics Engineers | $115,569 |
| Microsystems Engineers | $104,558 |
| Architectural and Engineering Managers | $101,277 |
| Wind Energy Engineers | $98,460 |
| Biofuels/Biodiesel Technology and Product Development Managers | $89,263 |
| Photonics Engineers | $84,667 |
References
- IPEDS — Integrated Postsecondary Education Data System
- U.S. Department of Education — College Scorecard
- O*NET Online (Bureau of Labor Statistics)
- National Center for Education Statistics
More about our data sources and methodologies.
Course Advisor provides higher-education, college and university, degree, program, career, salary, and other helpful information to students, faculty, institutions, and other internet audiences. Presented information and data are subject to change. Inclusion on this website does not imply or represent a direct relationship with the company, school, or brand. Information, though believed correct at time of publication, may not be correct, and no warranty is provided. Contact the schools to verify any information before relying on it. Financial aid may be available for those who qualify. The displayed options may include sponsored or recommended results, not necessarily based on your preferences.
© Course Advisor – All Rights Reserved.