Design & Applied Arts at Pennsylvania Academy of the Fine Arts
If you are interested in studying Design & Applied Arts, consider the program at Pennsylvania Academy of the Fine Arts. The following information will help you decide if it is a good fit for you.
Pennsylvania Academy of the Fine Arts is in Philadelphia, PA.
In the most recent year for which we have data, 11 design & applied arts degrees were awarded at Pennsylvania Academy of the Fine Arts.
Featured schools near , edit
Online Class Availability at Pennsylvania Academy of the Fine Arts
Many students take online classes at Pennsylvania Academy of the Fine Arts. Of 41 students, 8 (20%) were enrolled entirely in distance education and 21 (51%) took at least some classes online.
Design & Applied Arts Rankings at Pennsylvania Academy of the Fine Arts
Rankings can help you compare Pennsylvania Academy of the Fine Arts’s Design & Applied Arts program to other colleges that offer this major.
Bachelor’s-Level Rankings
| Ranking | Scope | Rank |
|---|---|---|
| Best Schools (Quality) | Pennsylvania | #27 of 28 |
| Best Value | Pennsylvania | #28 of 28 |
| Best Value | Middle Atlantic (Region) | #93 of 96 |
| Best Schools (Quality) | Middle Atlantic (Region) | #94 of 97 |
| Best Schools (Quality) | Nationwide | #574 of 603 |
| Best Value | Nationwide | #588 of 600 |
Student Demographics & Diversity
Take a look at the student demographics for Design & Applied Arts graduates at Pennsylvania Academy of the Fine Arts, by degree type.
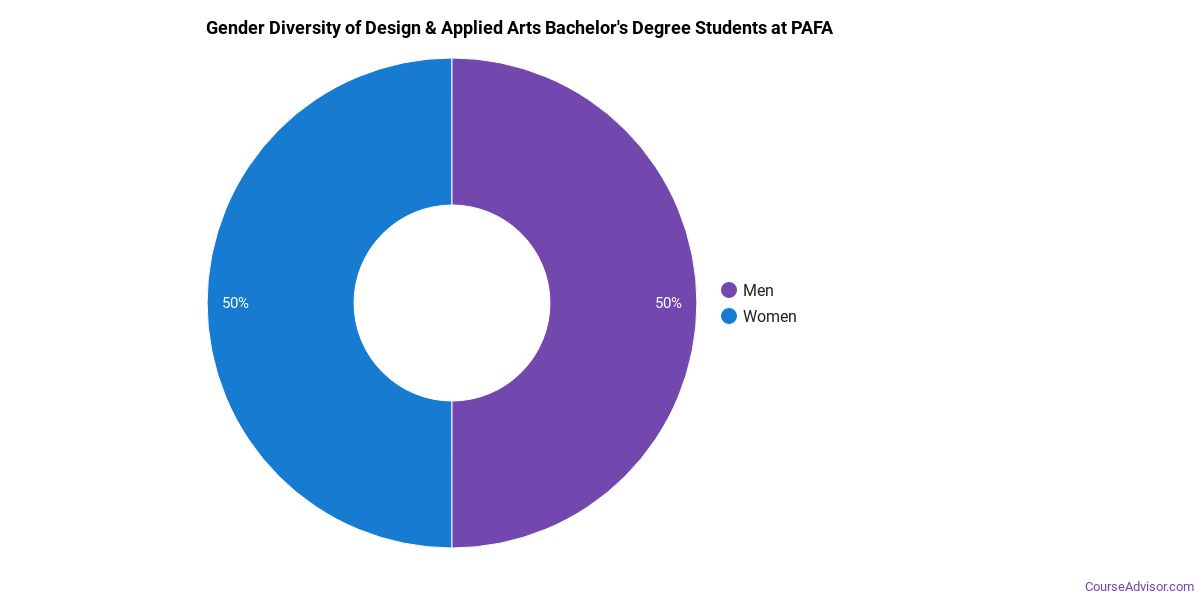
Across all degree levels, Design & Applied Arts graduates at Pennsylvania Academy of the Fine Arts are 73% women (8) and 27% men (3).
Design & Applied Arts Bachelor’s Program at Pennsylvania Academy of the Fine Arts
Of the 11 bachelor’s design & applied arts degrees awarded at Pennsylvania Academy of the Fine Arts, 73% were women (8) and 27% were men (3).
The following table and chart show the race/ethnicity of Design & Applied Arts bachelor’s degree recipients at Pennsylvania Academy of the Fine Arts.
| Race / Ethnicity | Number of Graduates |
|---|---|
| White | 3 |
| Hispanic / Latino | 1 |
| Black / African American | 4 |
| Asian | 2 |
| Two or More Races | 1 |
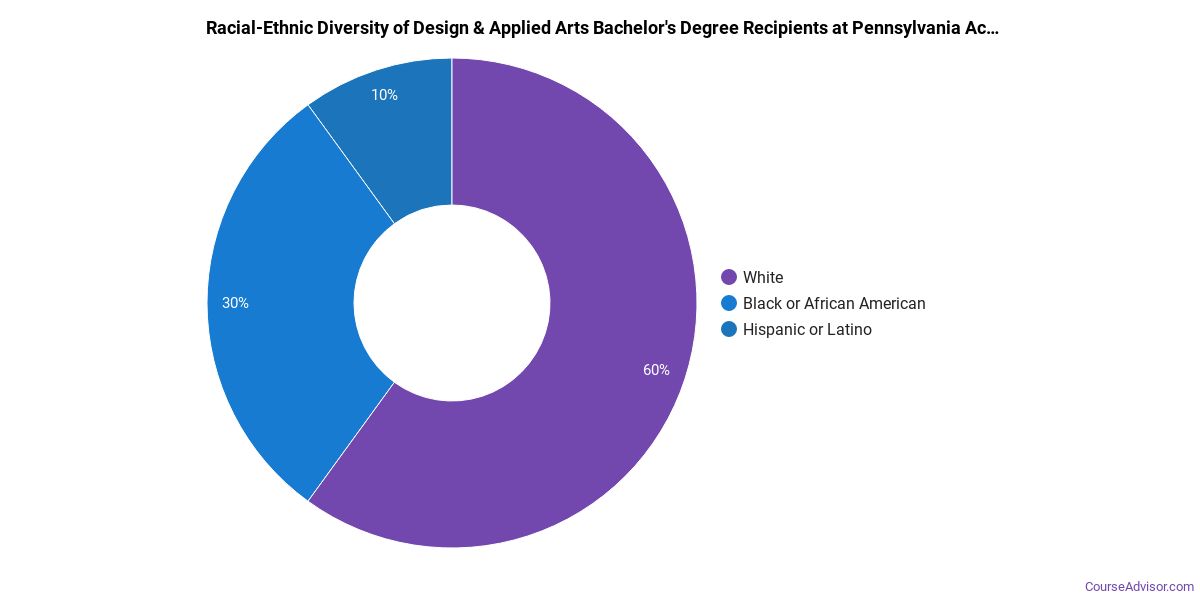
Racial-ethnic minorities make up 73% of Design & Applied Arts bachelor’s degree recipients at Pennsylvania Academy of the Fine Arts, higher than the national average of 37%.*
*The racial-ethnic minorities figure is the total number of graduates minus White, international (nonresident), and unknown-race graduates.
More Specific Design & Applied Arts Concentrations at Pennsylvania Academy of the Fine Arts
This Design & Applied Arts program at Pennsylvania Academy of the Fine Arts breaks down into more specific concentrations:
| Concentration | Graduates |
|---|---|
| Illustration | 11 |
Best-Paid Careers for Design & Applied Arts Graduates
Those who complete Design & Applied Arts program at Pennsylvania Academy of the Fine Arts pursue many career paths. Below are the best-paid careers for Design & Applied Arts graduates, ordered by median annual salary:
| Occupation | Nationwide Median Wage |
|---|---|
| Set and Exhibit Designers | $109,049 |
| Art Directors | $103,285 |
| Web and Digital Interface Designers | $88,198 |
| Artists and Related Workers, All Other | $83,610 |
| Photographers | $75,743 |
| Designers, All Other | $73,407 |
| Postsecondary Teachers, All Other | $68,967 |
| Architecture Teachers, Postsecondary | $66,757 |
| Graphic Designers | $66,386 |
| Video Game Designers | $62,617 |
References
- IPEDS — Integrated Postsecondary Education Data System
- U.S. Department of Education — College Scorecard
- O*NET Online (Bureau of Labor Statistics)
- National Center for Education Statistics
More about our data sources and methodologies.
Course Advisor provides higher-education, college and university, degree, program, career, salary, and other helpful information to students, faculty, institutions, and other internet audiences. Presented information and data are subject to change. Inclusion on this website does not imply or represent a direct relationship with the company, school, or brand. Information, though believed correct at time of publication, may not be correct, and no warranty is provided. Contact the schools to verify any information before relying on it. Financial aid may be available for those who qualify. The displayed options may include sponsored or recommended results, not necessarily based on your preferences.
© Course Advisor – All Rights Reserved.