Finance & Financial Management at Niagara University
If you are interested in studying Finance & Financial Management, take a look at what Niagara University. Get started with the following essential facts.
Niagara University sits in Niagara University, NY.
In the most recent year for which we have data, 33 finance & financial management graduations were recorded at Niagara University.
Featured schools near , edit
Online & Distance Learning at Niagara University
Online coursework is an option at Niagara University. Among 4,033 students, 841 (21%) were enrolled entirely in distance education and 1,634 (41%) took at least some classes online.
Finance & Financial Management Rankings at Niagara University
Rankings can help you compare Niagara University’s Finance & Financial Management program against other schools offering the same major.
Bachelor’s-Level Rankings
| Ranking | Scope | Rank |
|---|---|---|
| Best Schools (Quality) | New York | #14 of 37 |
| Best Value | New York | #15 of 37 |
| Best Value | Middle Atlantic (Region) | #31 of 102 |
| Best Schools (Quality) | Middle Atlantic (Region) | #46 of 102 |
| Best Schools (Quality) | Nationwide | #207 of 555 |
| Best Value | Nationwide | #262 of 552 |
Master’s-Level Rankings
| Ranking | Scope | Rank |
|---|---|---|
| Best Schools (Quality) | New York | #14 of 37 |
| Best Value | New York | #15 of 37 |
| Best Value | Middle Atlantic (Region) | #31 of 102 |
| Best Schools (Quality) | Middle Atlantic (Region) | #46 of 102 |
| Best Schools (Quality) | Nationwide | #207 of 555 |
| Best Value | Nationwide | #262 of 552 |
Student Demographics & Diversity
The following sections describe the diversity of Finance & Financial Management graduates at Niagara University, by degree type.
Across all degree levels, Finance & Financial Management graduates at Niagara University are 33% women (11) and 67% men (22).
Finance & Financial Management Bachelor’s Program at Niagara University
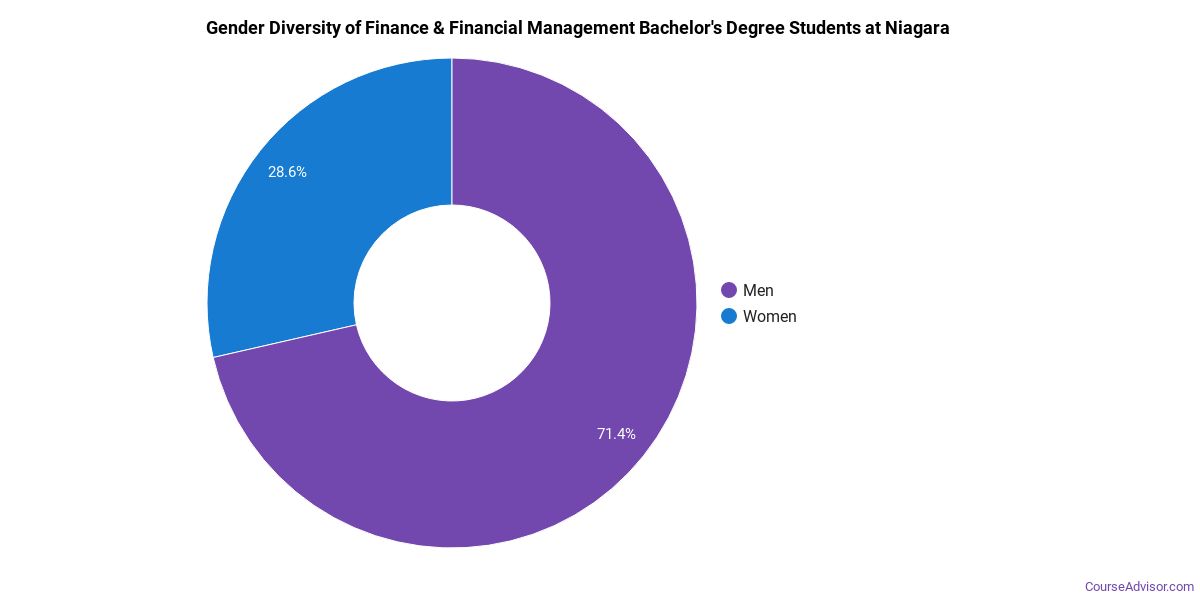
Among the 23 bachelor’s finance & financial management degrees awarded at Niagara University, 35% were women (8) and 65% were men (15).
The following table and chart show the race/ethnicity of Finance & Financial Management bachelor’s degree recipients at Niagara University.
| Race / Ethnicity | Number of Graduates |
|---|---|
| White | 15 |
| Hispanic / Latino | 2 |
| Black / African American | 1 |
| Asian | 2 |
| Two or More Races | 1 |
| International (Nonresident) | 2 |
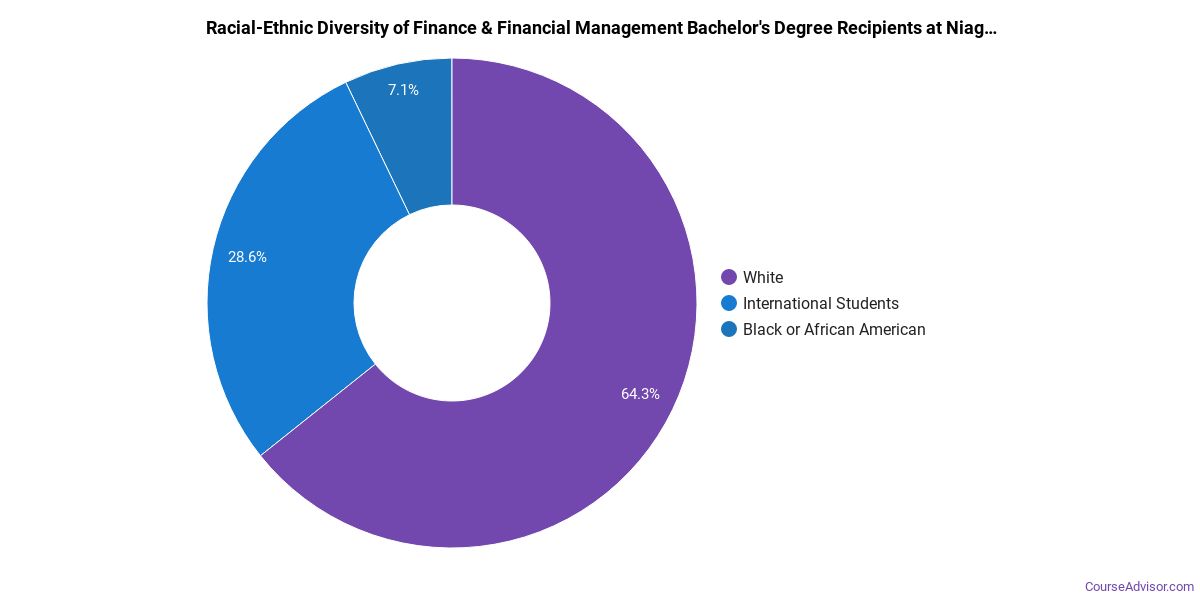
Racial-ethnic minorities make up 26% of Finance & Financial Management bachelor’s degree recipients at Niagara University, below the national average of 29%.*
Finance & Financial Management Master’s Program at Niagara University
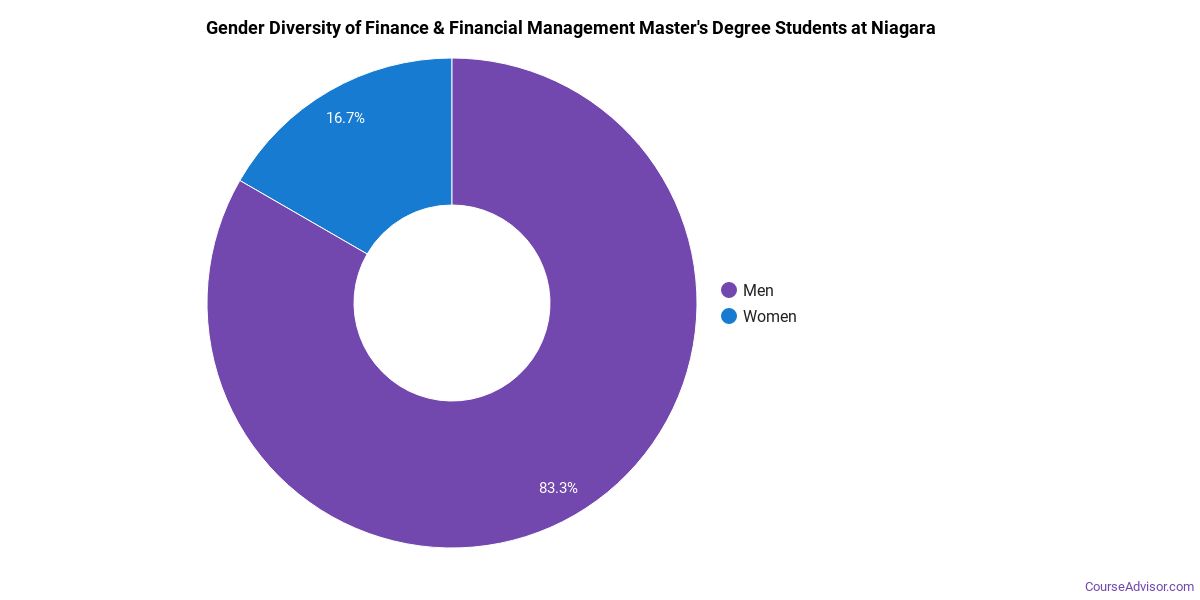
Of the 10 master’s finance & financial management graduates at Niagara University, 30% were women (3) and 70% were men (7).
The following table and chart show the race/ethnicity of Finance & Financial Management master’s degree recipients at Niagara University.
| Race / Ethnicity | Number of Graduates |
|---|---|
| White | 2 |
| Hispanic / Latino | 2 |
| Black / African American | 1 |
| International (Nonresident) | 5 |
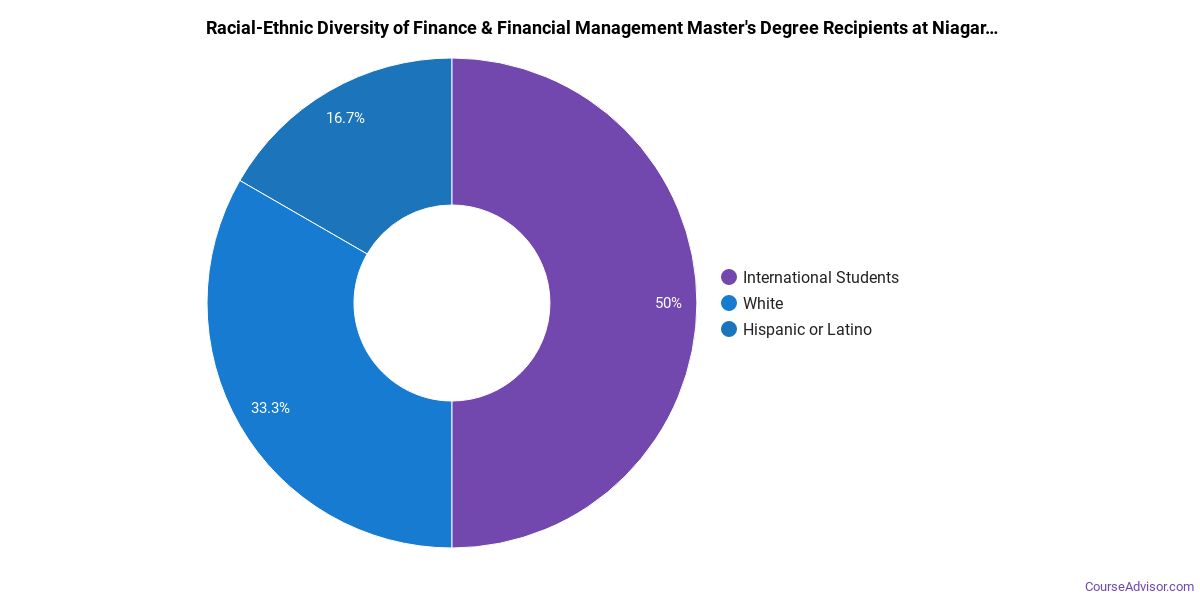
Racial-ethnic minorities make up 30% of Finance & Financial Management master’s degree recipients at Niagara University, higher than the national average of 27%.*
*The racial-ethnic minorities figure is the total number of graduates minus White, international (nonresident), and unknown-race graduates.
More Specific Finance & Financial Management Concentrations at Niagara University
This Finance & Financial Management program at Niagara University offers more specialized concentrations:
| Concentration | Graduates |
|---|---|
| Public Finance | 33 |
Top-Paying Careers for Finance & Financial Management Graduates
Those who complete Finance & Financial Management program at Niagara University pursue many career paths. The table below ranks the best-paid careers for Finance & Financial Management graduates, ordered by median annual salary:
| Occupation | Nationwide Median Wage |
|---|---|
| Treasurers and Controllers | $162,461 |
| Investment Fund Managers | $157,819 |
| General and Operations Managers | $149,694 |
| Chief Executives | $138,534 |
| Insurance Underwriters | $129,939 |
| Financial Risk Specialists | $127,364 |
| Financial Quantitative Analysts | $126,371 |
| Appraisers of Personal and Business Property | $118,242 |
| Chief Sustainability Officers | $96,628 |
| Fraud Examiners, Investigators and Analysts | $92,240 |
References
- IPEDS — Integrated Postsecondary Education Data System
- U.S. Department of Education — College Scorecard
- O*NET Online (Bureau of Labor Statistics)
- National Center for Education Statistics
More about our data sources and methodologies.
Course Advisor provides higher-education, college and university, degree, program, career, salary, and other helpful information to students, faculty, institutions, and other internet audiences. Presented information and data are subject to change. Inclusion on this website does not imply or represent a direct relationship with the company, school, or brand. Information, though believed correct at time of publication, may not be correct, and no warranty is provided. Contact the schools to verify any information before relying on it. Financial aid may be available for those who qualify. The displayed options may include sponsored or recommended results, not necessarily based on your preferences.
© Course Advisor – All Rights Reserved.