Health & Physical Education at Linfield University
If you are interested in studying Health & Physical Education, take a look at what Linfield University. The following information will help you decide if it is a good fit for you.
Linfield University is in McMinnville, OR.
For the most recent IPEDS reporting year, 53 health & physical education degrees were awarded at Linfield University.
Featured schools near , edit
Online Class Availability at Linfield University
Distance learning is available at Linfield University. Of 1,709 students, 105 (6%) were enrolled entirely in distance education and 286 (17%) took at least some classes online.
Health & Physical Education Rankings at Linfield University
Rankings can help you compare Linfield University’s Health & Physical Education program against other schools offering the same major.
Bachelor’s-Level Rankings
| Ranking | Scope | Rank |
|---|---|---|
| Best Schools (Quality) | Oregon | #3 of 12 |
| Best Value | Oregon | #10 of 12 |
| Best Schools (Quality) | Far Western (Region) | #59 of 151 |
| Best Value | Far Western (Region) | #130 of 151 |
| Best Schools (Quality) | Nationwide | #320 of 953 |
| Best Value | Nationwide | #839 of 952 |
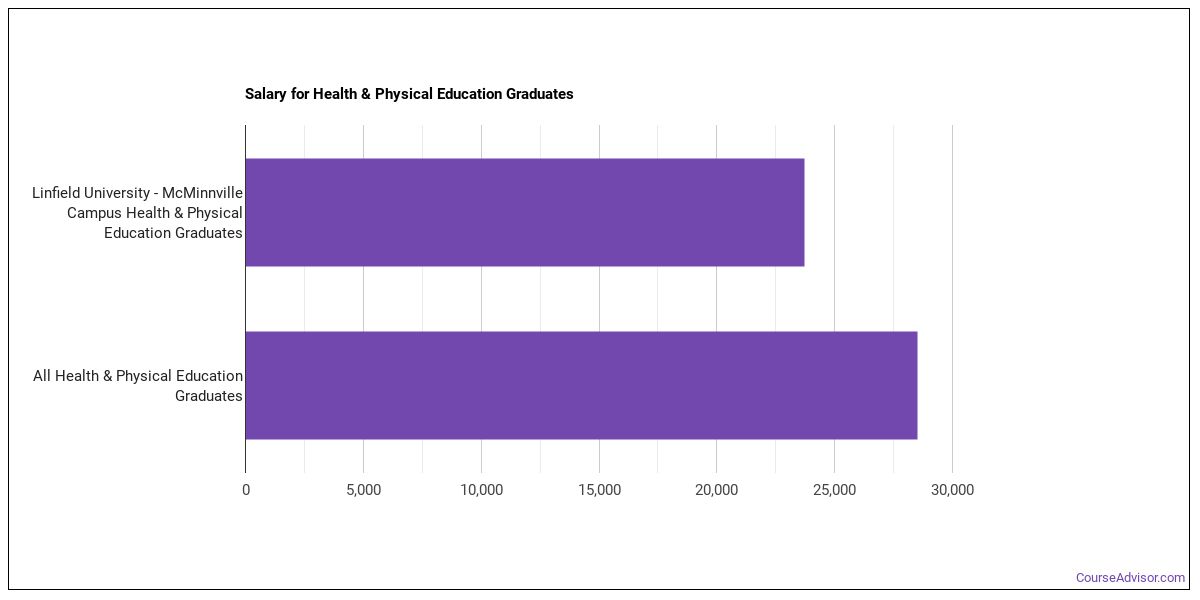
Earnings for Health & Physical Education Graduates from Linfield University
Those who finish Linfield University’s Health & Physical Education program earn at the following median levels (per the U.S. Department of Education’s College Scorecard):
| Years After Graduation | Median Earnings |
|---|---|
| 1 year | $23,712 |
| 2 years | $34,856 |
| 5 years | $99,698 |
Median Debt at Graduation
Typical debt at graduation for Health & Physical Education graduates from Linfield University comes in at $27,000.
Student Demographics & Diversity
Below you’ll find the student demographics for Health & Physical Education graduates at Linfield University, broken down by degree level.
Looking at the program as a whole, Health & Physical Education graduates at Linfield University are 40% women (21) and 60% men (32).
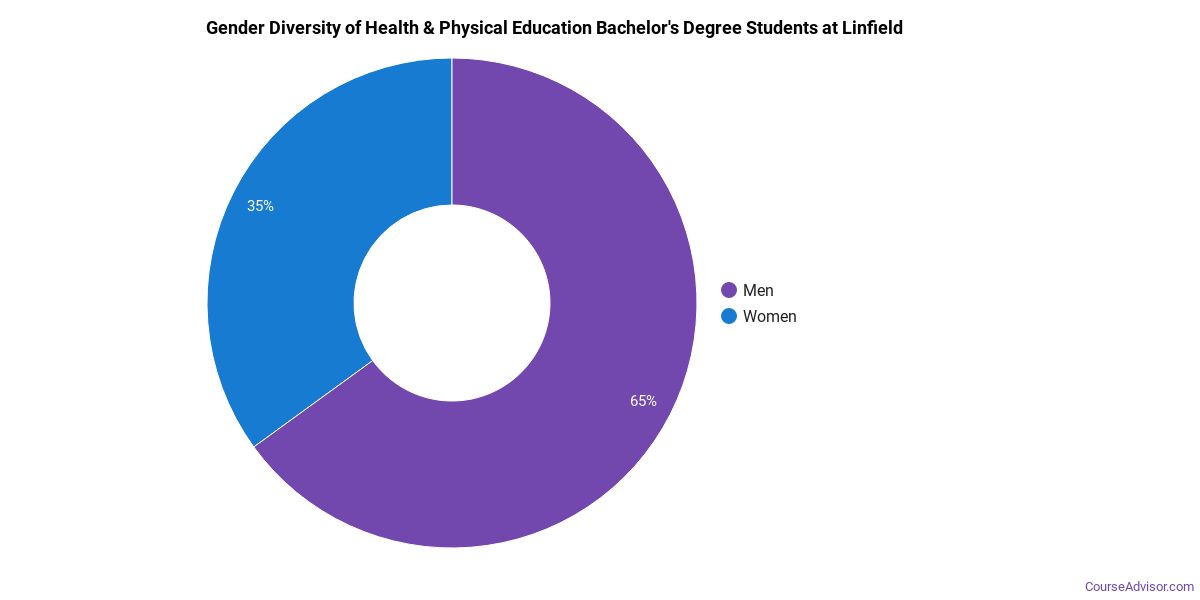
Health & Physical Education Bachelor’s Program at Linfield University
Of the 47 bachelor’s health & physical education graduates at Linfield University, 36% were women (17) and 64% were men (30).
The following table and chart show the race/ethnicity of Health & Physical Education bachelor’s degree recipients at Linfield University.
| Race / Ethnicity | Number of Graduates |
|---|---|
| White | 31 |
| Hispanic / Latino | 5 |
| Black / African American | 1 |
| Asian | 1 |
| Two or More Races | 8 |
| Unknown | 1 |
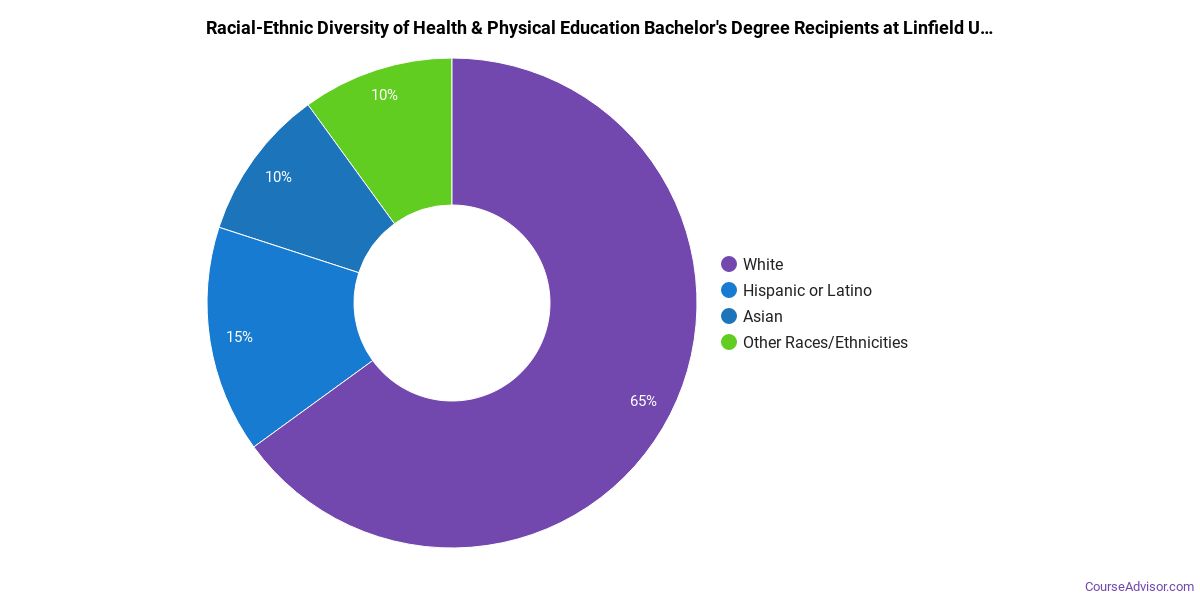
Minority students account for 32% of Health & Physical Education bachelor’s degree recipients at Linfield University, below the national average of 40%.*
Health & Physical Education Master’s Program at Linfield University
Among the 6 master’s health & physical education degrees awarded at Linfield University, 67% were women (4) and 33% were men (2).

The following table and chart show the race/ethnicity of Health & Physical Education master’s degree recipients at Linfield University.
| Race / Ethnicity | Number of Graduates |
|---|---|
| White | 4 |
| Hispanic / Latino | 1 |
| Two or More Races | 1 |

Racial-ethnic minorities make up 33% of Health & Physical Education master’s degree recipients at Linfield University, lower than the national average of 34%.*
*The racial-ethnic minorities figure is the total number of graduates minus White, international (nonresident), and unknown-race graduates.
More Specific Health & Physical Education Concentrations at Linfield University
This Health & Physical Education program at Linfield University breaks down into more specific concentrations:
| Concentration | Graduates |
|---|---|
| Sports Management | 25 |
| Exercise Science | 28 |
Highest-Paying Careers for Health & Physical Education Graduates
Those who complete Health & Physical Education program at Linfield University pursue many career paths. Here are the top-paying careers for Health & Physical Education graduates, ordered by median annual salary:
| Occupation | Nationwide Median Wage |
|---|---|
| Entertainment and Recreation Managers, Except Gambling | $170,172 |
| Exercise Physiologists | $144,072 |
| Recreation and Fitness Studies Teachers, Postsecondary | $84,688 |
| Athletic Trainers | $79,834 |
| Coaches and Scouts | $78,709 |
| Exercise Trainers and Group Fitness Instructors | $54,441 |
| Athletes and Sports Competitors | $39,714 |
References
- IPEDS — Integrated Postsecondary Education Data System
- U.S. Department of Education — College Scorecard
- O*NET Online (Bureau of Labor Statistics)
- National Center for Education Statistics
More about our data sources and methodologies.
Course Advisor provides higher-education, college and university, degree, program, career, salary, and other helpful information to students, faculty, institutions, and other internet audiences. Presented information and data are subject to change. Inclusion on this website does not imply or represent a direct relationship with the company, school, or brand. Information, though believed correct at time of publication, may not be correct, and no warranty is provided. Contact the schools to verify any information before relying on it. Financial aid may be available for those who qualify. The displayed options may include sponsored or recommended results, not necessarily based on your preferences.
© Course Advisor – All Rights Reserved.