Design & Applied Arts at Lindenwood University
If you are interested in studying Design & Applied Arts, take a look at what Lindenwood University. The following information will help you decide if it is a good fit for you.
Lindenwood University sits in Saint Charles, MO.
During the most recent reporting year, 28 design & applied arts degrees were awarded at Lindenwood University.
Featured schools near , edit
Online & Distance Learning at Lindenwood University
Distance learning is available at Lindenwood University. Of 6,826 students, 3,177 (47%) were enrolled entirely in distance education and 2,994 (44%) took at least some classes online.
Design & Applied Arts Rankings at Lindenwood University
These rankings give you a sense of how Lindenwood University’s Design & Applied Arts program to other colleges that offer this major.
Bachelor’s-Level Rankings
| Ranking | Scope | Rank |
|---|---|---|
| Best Schools (Quality) | Missouri | #9 of 15 |
| Best Value | Missouri | #9 of 15 |
| Best Schools (Quality) | The Plains States (Region) | #40 of 53 |
| Best Value | The Plains States (Region) | #41 of 53 |
| Best Schools (Quality) | Nationwide | #330 of 603 |
| Best Value | Nationwide | #401 of 600 |
Master’s-Level Rankings
| Ranking | Scope | Rank |
|---|---|---|
| Best Schools (Quality) | Missouri | #9 of 15 |
| Best Value | Missouri | #9 of 15 |
| Best Schools (Quality) | The Plains States (Region) | #40 of 53 |
| Best Value | The Plains States (Region) | #41 of 53 |
| Best Schools (Quality) | Nationwide | #330 of 603 |
| Best Value | Nationwide | #401 of 600 |
Student Demographics & Diversity
Below you’ll find the student demographics for Design & Applied Arts graduates at Lindenwood University, broken down by degree level.
Across all degree levels, Design & Applied Arts graduates at Lindenwood University are 46% women (13) and 54% men (15).
Design & Applied Arts Bachelor’s Program at Lindenwood University
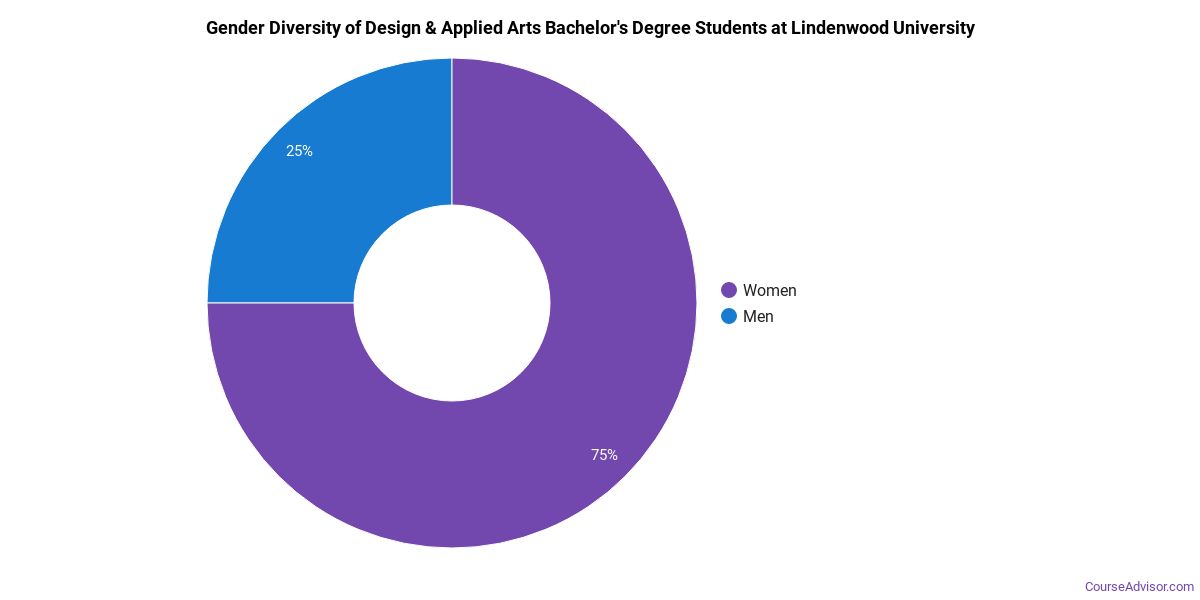
Of the 19 bachelor’s design & applied arts graduates at Lindenwood University, 53% were women (10) and 47% were men (9).
The following table and chart show the race/ethnicity of Design & Applied Arts bachelor’s degree recipients at Lindenwood University.
| Race / Ethnicity | Number of Graduates |
|---|---|
| White | 13 |
| Black / African American | 2 |
| Asian | 1 |
| American Indian / Alaska Native | 1 |
| International (Nonresident) | 1 |
| Unknown | 1 |
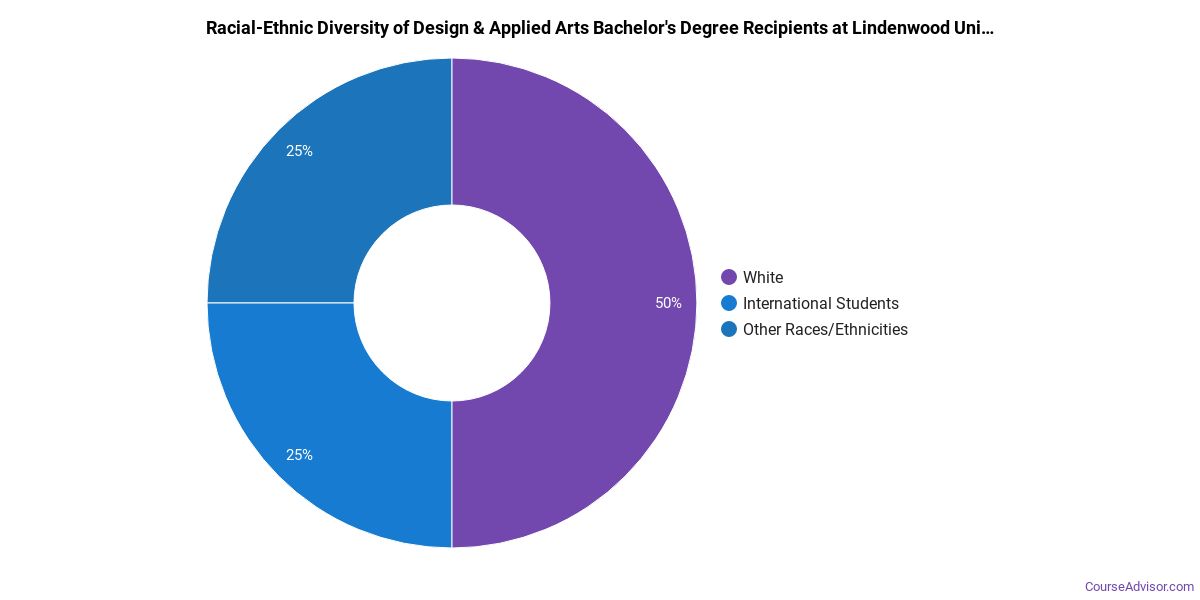
Minority students account for 21% of Design & Applied Arts bachelor’s degree recipients at Lindenwood University, lower than the national average of 37%.*
Design & Applied Arts Master’s Program at Lindenwood University
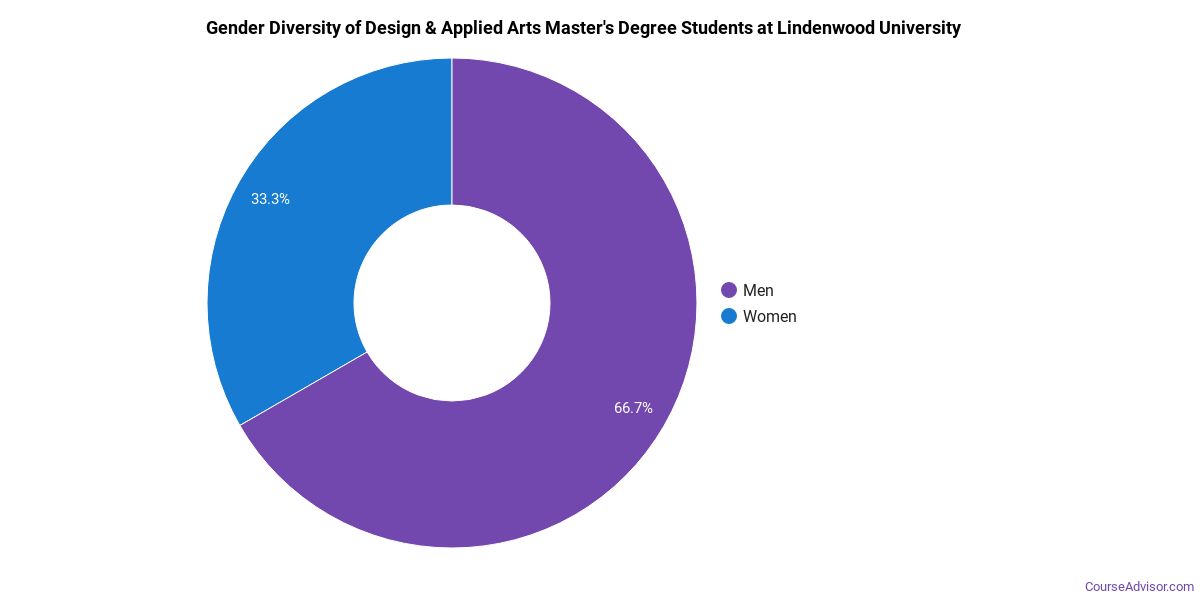
Among the 9 master’s design & applied arts graduates at Lindenwood University, 33% were women (3) and 67% were men (6).
The following table and chart show the race/ethnicity of Design & Applied Arts master’s degree recipients at Lindenwood University.
| Race / Ethnicity | Number of Graduates |
|---|---|
| White | 6 |
| Hispanic / Latino | 1 |
| Black / African American | 1 |
| Asian | 1 |
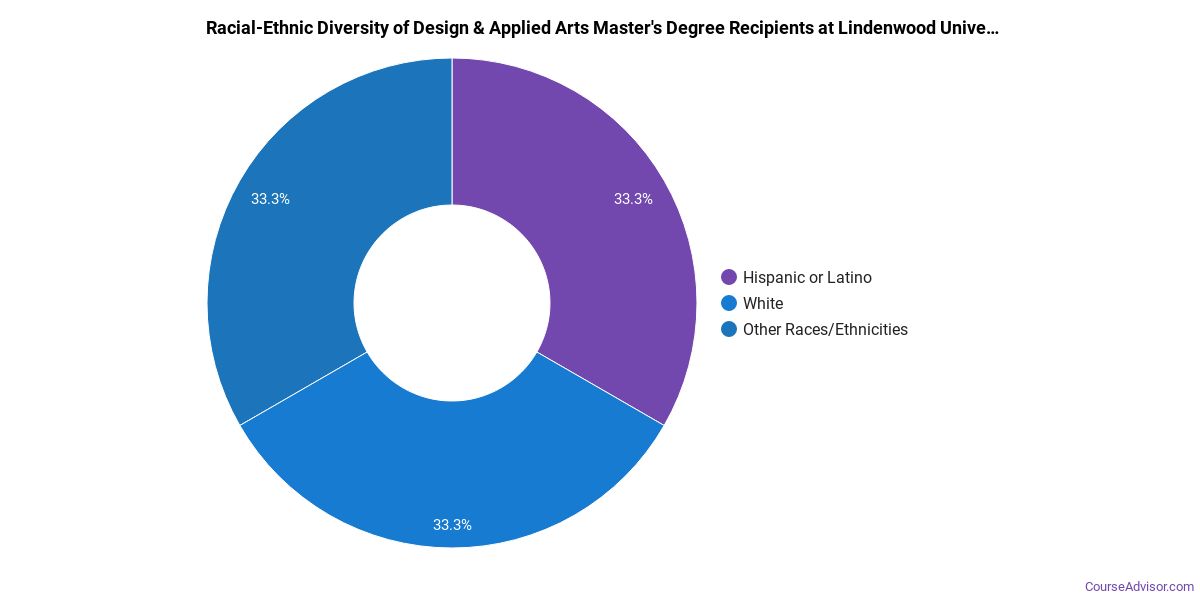
Minority students account for 33% of Design & Applied Arts master’s degree recipients at Lindenwood University, higher than the national average of 25%.*
*The racial-ethnic minorities figure is the total number of graduates minus White, international (nonresident), and unknown-race graduates.
More Specific Design & Applied Arts Concentrations at Lindenwood University
This Design & Applied Arts program at Lindenwood University offers more specialized concentrations:
| Concentration | Graduates |
|---|---|
| Fashion Design | 7 |
| Game & Interactive Media Design | 21 |
Top-Paying Careers for Design & Applied Arts Graduates
Those who complete Design & Applied Arts program at Lindenwood University pursue many career paths. Below are the best-paid careers for Design & Applied Arts majors, ordered by median annual salary:
| Occupation | Nationwide Median Wage |
|---|---|
| Set and Exhibit Designers | $109,049 |
| Art Directors | $103,285 |
| Web and Digital Interface Designers | $88,198 |
| Artists and Related Workers, All Other | $83,610 |
| Photographers | $75,743 |
| Designers, All Other | $73,407 |
| Postsecondary Teachers, All Other | $68,967 |
| Architecture Teachers, Postsecondary | $66,757 |
| Graphic Designers | $66,386 |
| Video Game Designers | $62,617 |
References
- IPEDS — Integrated Postsecondary Education Data System
- U.S. Department of Education — College Scorecard
- O*NET Online (Bureau of Labor Statistics)
- National Center for Education Statistics
More about our data sources and methodologies.
Course Advisor provides higher-education, college and university, degree, program, career, salary, and other helpful information to students, faculty, institutions, and other internet audiences. Presented information and data are subject to change. Inclusion on this website does not imply or represent a direct relationship with the company, school, or brand. Information, though believed correct at time of publication, may not be correct, and no warranty is provided. Contact the schools to verify any information before relying on it. Financial aid may be available for those who qualify. The displayed options may include sponsored or recommended results, not necessarily based on your preferences.
© Course Advisor – All Rights Reserved.