Lindenwood University Overview
Located in Saint Charles, Missouri, Lindenwood University is a private not-for-profit institution. Saint Charles is a great location for students who prefer city over country life.
What Is Lindenwood University Known For?
- The highest award offered at Lindenwood University is the doctor's degree.
- During a recent academic cycle, 100% of the faculty were full-time.
- A student who earns a bachelor's degree from Lindenwood University makes roughly $53,278 a year. This is 31% more than their peers from other colleges and universities.
Where Is Lindenwood University?
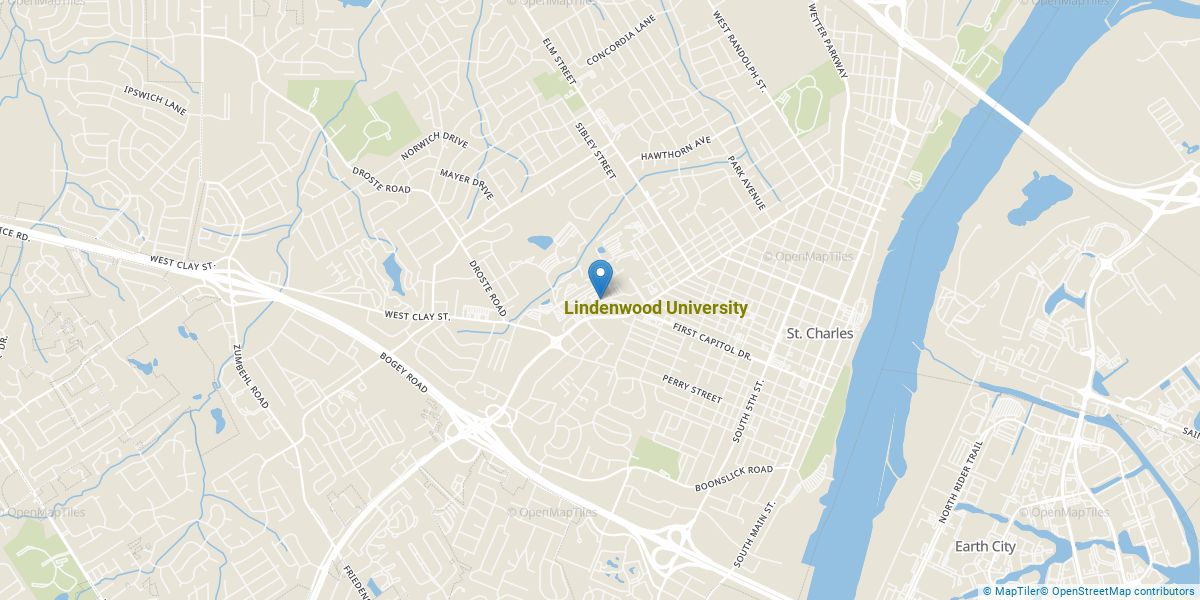
Contact details for Lindenwood University are given below.
| Contact Details | |
|---|---|
| Address: | 209 S Kingshighway St, Saint Charles, MO 63301-1695 |
| Phone: | 636-949-2000 |
| Website: | www.lindenwood.edu |
How Do I Get Into Lindenwood University?
You can apply to Lindenwood University online at: https://www.lindenwood.edu/admissions/apply/
Admission Requirements for Lindenwood University
| Submission | Required? |
|---|---|
| High School GPA | 1 |
| High School Rank | 5 |
| High School Transcript | 5 |
| College Prep Program | 5 |
| Recommendations | 5 |
| SAT or ACT Scores | 5 |
| TOEFL | 1 |
How Hard Is It To Get Into Lindenwood University?
Approximately 41% of accepted students are men and 59% are women. The acceptance rate for men is 71%, and the acceptance rate for women is 77%.
Average Test Scores
About 6% of students accepted to Lindenwood University submitted their SAT scores. When looking at the 25th through the 75th percentile, SAT Evidence-Based Reading and Writing scores ranged between 503 and 620. Math scores were between 520 and 610.
Can I Afford Lindenwood University?
The net price is calculated by adding tuition, room, board and other costs and subtracting financial aid.
Student Loan Debt
Almost 66% of college students who graduated with the class of 2018 took out student loans, but that percentage varies from school to school. At Lindenwood University, approximately 67% of students took out student loans averaging $6,904 a year. That adds up to $27,616 over four years for those students.
Explore Best Ranked Schools for You
Lindenwood University Undergraduate Student Diversity
There are also 2,560 graduate students at the school.
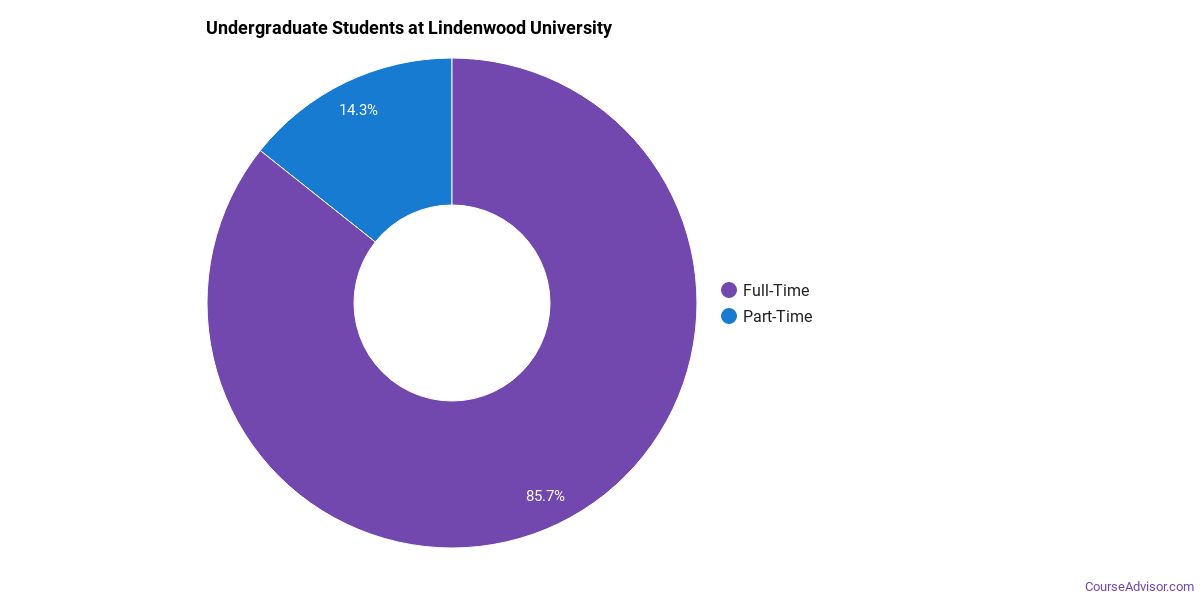
Gender Diversity
Of the 4,199 full-time undergraduates at Lindenwood University, 44% are male and 56% are female.

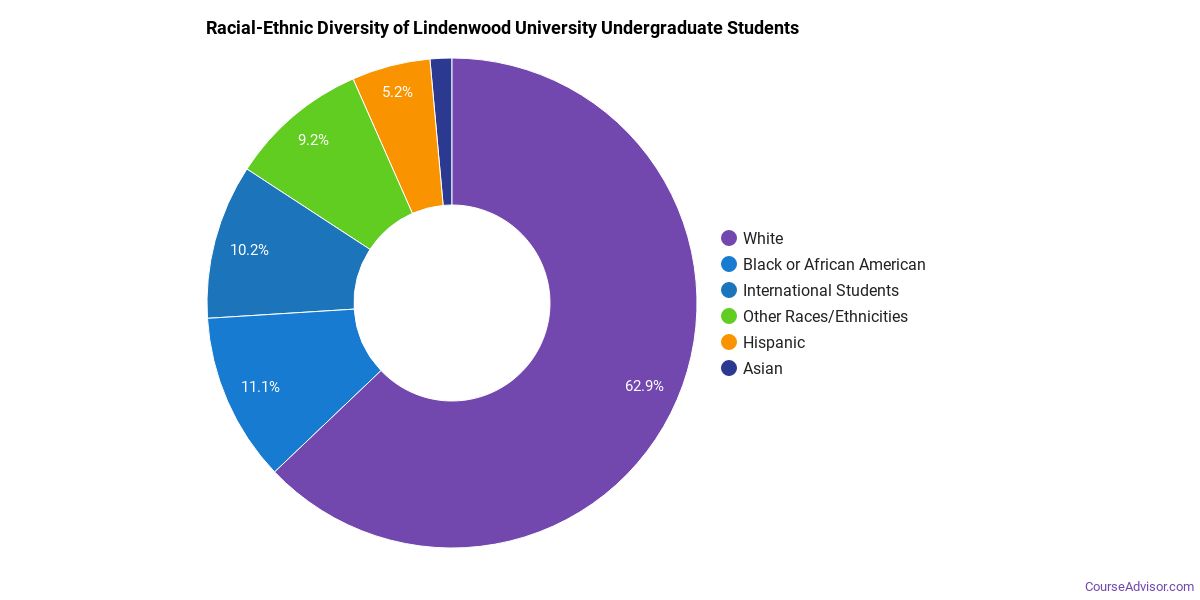
Racial-Ethnic Diversity
The racial-ethnic breakdown of Lindenwood University students is as follows.
| Race/Ethnicity | Number of Grads |
|---|---|
| Asian | 49 |
| Black or African American | 534 |
| Hispanic or Latino | 203 |
| White | 2,541 |
| International Students | 427 |
| Other Races/Ethnicities | 445 |
Geographic Diversity
Missouri students aren't the only ones who study at Lindenwood University. At this time, 41 states are represented by the student population at the school.
Over 108 countries are represented at Lindenwood University. The most popular countries sending students to the school are Venezuela, Panama, and Canada.
Lindenwood University Undergraduate Concentrations
The table below shows the number of awards for each concentration.
References
*The racial-ethnic minorities count is calculated by taking the total number of students and subtracting white students, international students, and students whose race/ethnicity was unknown. This number is then divided by the total number of students at the school to obtain the racial-ethnic minorities percentage.
- College Factual
- National Center for Education Statistics
- Image Credit: By Bhockey10 under License
More about our data sources and methodologies.
Course Advisor provides higher-education, college and university, degree, program, career, salary, and other helpful information to students, faculty, institutions, and other internet audiences. Presented information and data are subject to change. Inclusion on this website does not imply or represent a direct relationship with the company, school, or brand. Information, though believed correct at time of publication, may not be correct, and no warranty is provided. Contact the schools to verify any information before relying on it. Financial aid may be available for those who qualify. The displayed options may include sponsored or recommended results, not necessarily based on your preferences.
© Course Advisor – All Rights Reserved.