Rehabilitation Professions at Lindenwood University
If you plan to study Rehabilitation Professions, take a look at what Lindenwood University. We’ve gathered the following information to help you decide.
Lindenwood University is in Saint Charles, MO.
In the most recent year for which we have data, 9 rehabilitation professions degrees were awarded at Lindenwood University.
Featured schools near , edit
Online & Distance Learning at Lindenwood University
Online coursework is an option at Lindenwood University. Of 6,826 students, 3,177 (47%) studied exclusively online and 2,994 (44%) took at least some classes online.
Rehabilitation Professions Rankings at Lindenwood University
These rankings give you a sense of how Lindenwood University’s Rehabilitation Professions program against peer institutions.
Student Demographics & Diversity
The following sections describe the diversity of Rehabilitation Professions graduates at Lindenwood University, by degree type.
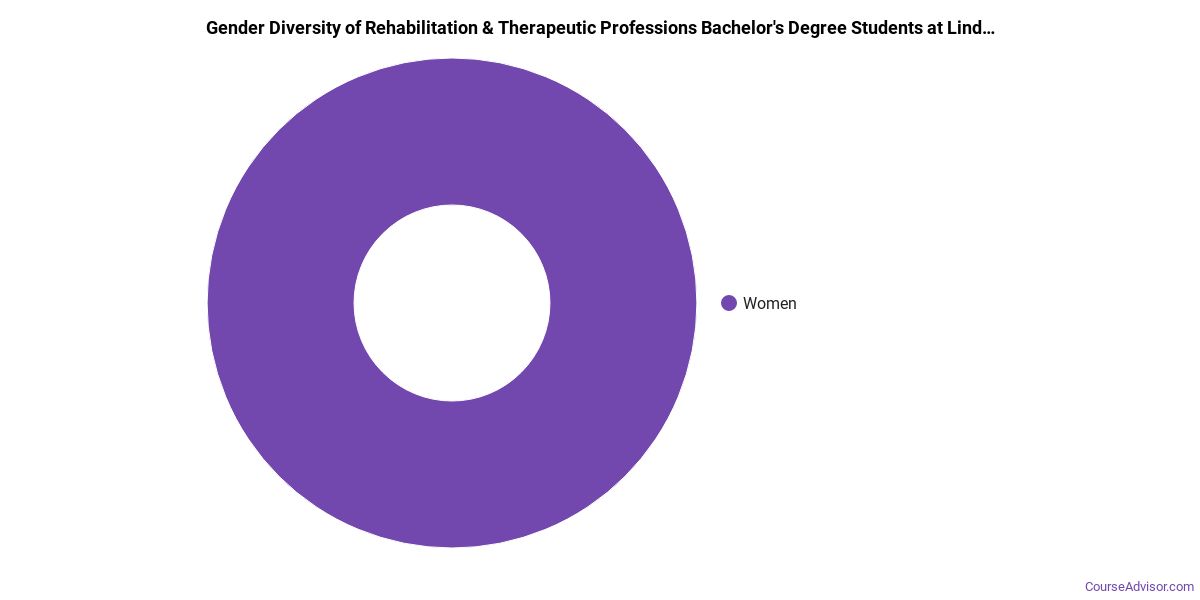
Looking at the program as a whole, Rehabilitation Professions graduates at Lindenwood University are 78% women (7) and 22% men (2).
Rehabilitation Professions Bachelor’s Program at Lindenwood University
Of the 9 bachelor’s rehabilitation professions degrees awarded at Lindenwood University, 78% were women (7) and 22% were men (2).
The following table and chart show the race/ethnicity of Rehabilitation Professions bachelor’s degree recipients at Lindenwood University.
| Race / Ethnicity | Number of Graduates |
|---|---|
| White | 5 |
| Black / African American | 1 |
| Native Hawaiian / Pacific Islander | 1 |
| International (Nonresident) | 1 |
| Unknown | 1 |
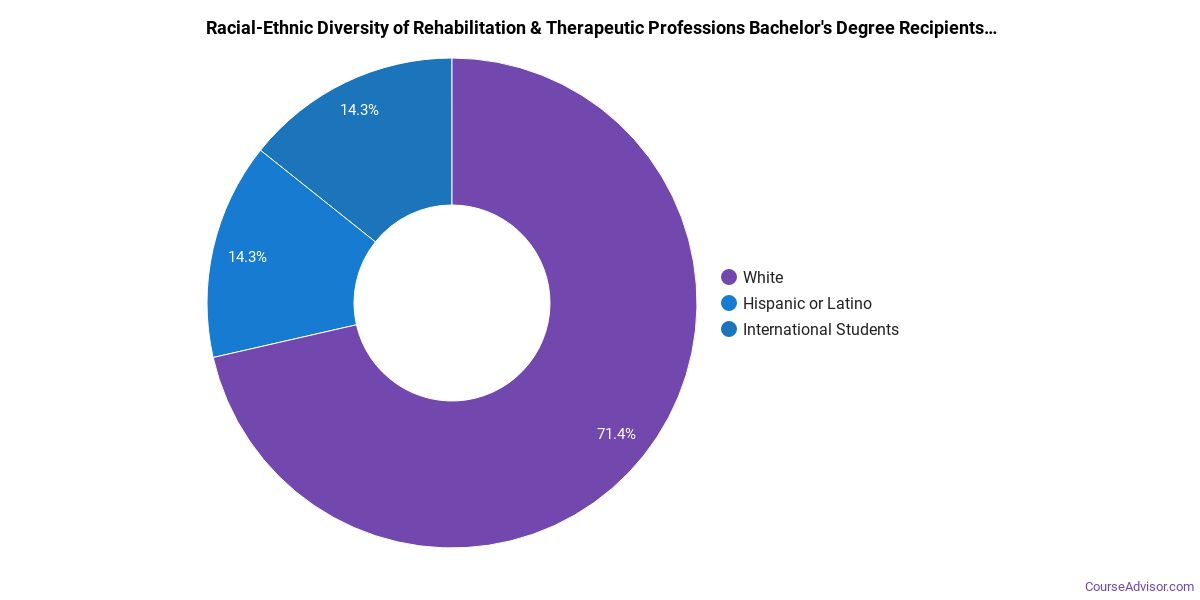
Racial-ethnic minorities make up 22% of Rehabilitation Professions bachelor’s degree recipients at Lindenwood University, lower than the national average of 34%.*
*The racial-ethnic minorities figure is the total number of graduates minus White, international (nonresident), and unknown-race graduates.
More Specific Rehabilitation Professions Concentrations at Lindenwood University
The Rehabilitation Professions program at Lindenwood University breaks down into more specific concentrations:
| Concentration | Graduates |
|---|---|
| Recreational Therapy | 9 |
Top-Paying Careers for Rehabilitation Professions Graduates
Graduates of the Rehabilitation Professions program at Lindenwood University pursue many career paths. The table below ranks the best-paid careers for Rehabilitation Professions graduates, ordered by median annual salary:
| Occupation | Nationwide Median Wage |
|---|---|
| Recreational Therapists | $150,116 |
| Exercise Physiologists | $144,072 |
| Physical Therapists | $144,047 |
| Engineers, All Other | $136,628 |
| Low Vision Therapists, Orientation and Mobility Specialists, and Vision Rehabilitation Therapists | $124,839 |
| Therapists, All Other | $121,750 |
| Solar Energy Systems Engineers | $116,775 |
| Mechatronics Engineers | $115,569 |
| Microsystems Engineers | $104,558 |
| Wind Energy Engineers | $98,460 |
References
- IPEDS — Integrated Postsecondary Education Data System
- U.S. Department of Education — College Scorecard
- O*NET Online (Bureau of Labor Statistics)
- National Center for Education Statistics
More about our data sources and methodologies.
Course Advisor provides higher-education, college and university, degree, program, career, salary, and other helpful information to students, faculty, institutions, and other internet audiences. Presented information and data are subject to change. Inclusion on this website does not imply or represent a direct relationship with the company, school, or brand. Information, though believed correct at time of publication, may not be correct, and no warranty is provided. Contact the schools to verify any information before relying on it. Financial aid may be available for those who qualify. The displayed options may include sponsored or recommended results, not necessarily based on your preferences.
© Course Advisor – All Rights Reserved.