Music at Lindenwood University
If you plan to study Music, you may want to check out the program at Lindenwood University. Get started with the following essential facts.
Lindenwood University is located in Saint Charles, MO.
In the most recent year for which we have data, 3 music degrees were awarded at Lindenwood University.
Featured schools near , edit
Online Class Availability at Lindenwood University
Many students take online classes at Lindenwood University. Among 6,826 students, 3,177 (47%) studied exclusively online and 2,994 (44%) took at least some classes online.
Music Rankings at Lindenwood University
Use these rankings to compare Lindenwood University’s Music program to other colleges that offer this major.
Student Demographics & Diversity
Below you’ll find the diversity of Music graduates at Lindenwood University, broken down by degree level.
Program-wide, Music graduates at Lindenwood University are 67% women (2) and 33% men (1).
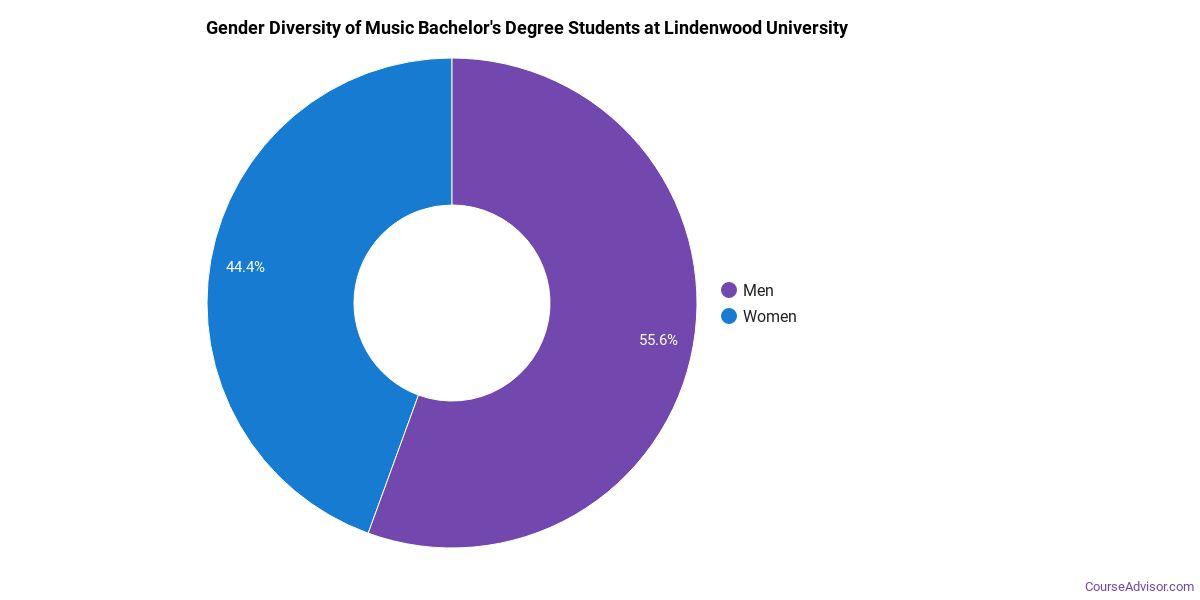
Music Bachelor’s Program at Lindenwood University
Of the 3 bachelor’s music graduates at Lindenwood University, 67% were women (2) and 33% were men (1).
The following table and chart show the race/ethnicity of Music bachelor’s degree recipients at Lindenwood University.
| Race / Ethnicity | Number of Graduates |
|---|---|
| White | 3 |
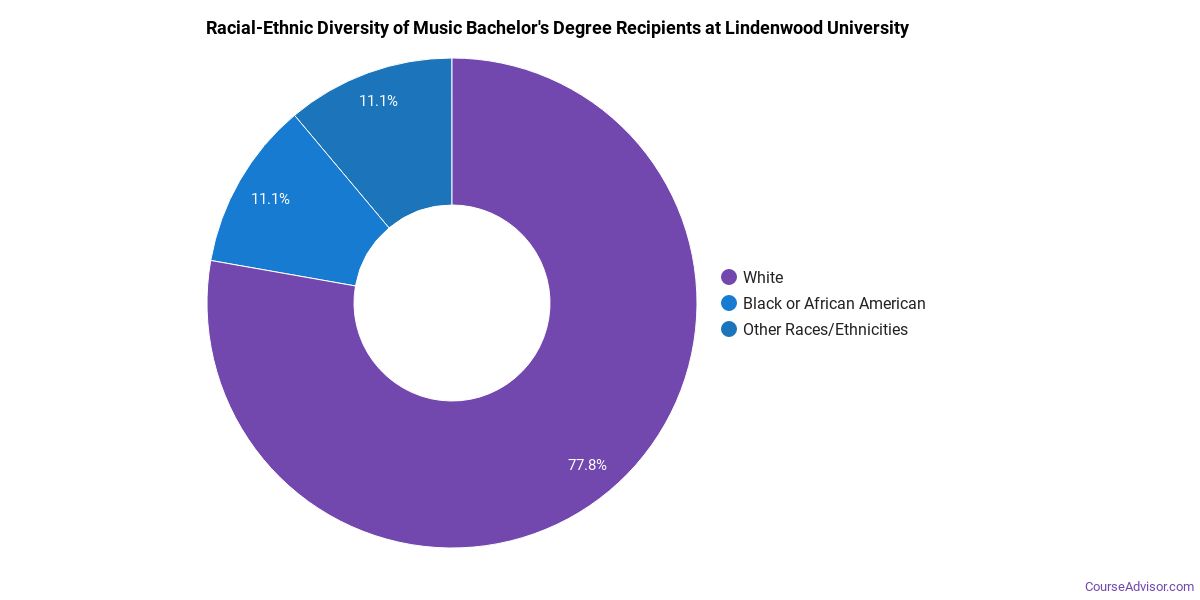
*The racial-ethnic minorities figure is the total number of graduates minus White, international (nonresident), and unknown-race graduates.
More Specific Music Concentrations at Lindenwood University
The Music program at Lindenwood University offers more specialized concentrations:
| Concentration | Graduates |
|---|---|
| General Music | 3 |
Best-Paid Careers for Music Graduates
Graduates of the Music program at Lindenwood University work across a variety of fields. Below are the top-paying careers for Music majors, ordered by median annual salary:
| Occupation | Nationwide Median Wage |
|---|---|
| Musicians and Singers | $96,571 |
| Disc Jockeys, Except Radio | $87,328 |
| Secondary School Teachers, Except Special and Career/Technical Education | $77,927 |
| Music Directors and Composers | $66,915 |
| Sound Engineering Technicians | $66,427 |
| Art, Drama, and Music Teachers, Postsecondary | $46,983 |
References
- IPEDS — Integrated Postsecondary Education Data System
- U.S. Department of Education — College Scorecard
- O*NET Online (Bureau of Labor Statistics)
- National Center for Education Statistics
More about our data sources and methodologies.
Course Advisor provides higher-education, college and university, degree, program, career, salary, and other helpful information to students, faculty, institutions, and other internet audiences. Presented information and data are subject to change. Inclusion on this website does not imply or represent a direct relationship with the company, school, or brand. Information, though believed correct at time of publication, may not be correct, and no warranty is provided. Contact the schools to verify any information before relying on it. Financial aid may be available for those who qualify. The displayed options may include sponsored or recommended results, not necessarily based on your preferences.
© Course Advisor – All Rights Reserved.