Health/Medical Admin Services at Lindenwood University
If you are interested in studying Health/Medical Admin Services, take a look at what Lindenwood University. The following information will help you decide if it is a good fit for you.
Lindenwood University is in Saint Charles, MO.
For the most recent IPEDS reporting year, 26 health/medical admin services degrees were awarded at Lindenwood University.
Featured schools near , edit
Online & Distance Learning at Lindenwood University
Many students take online classes at Lindenwood University. Of 6,826 students, 3,177 (47%) studied exclusively online and 2,994 (44%) took at least some classes online.
Health/Medical Admin Services Rankings at Lindenwood University
These rankings give you a sense of how Lindenwood University’s Health/Medical Admin Services program to other colleges that offer this major.
Bachelor’s-Level Rankings
| Ranking | Scope | Rank |
|---|---|---|
| Best Schools (Quality) | Missouri | #8 of 22 |
| Best Value | Missouri | #11 of 21 |
| Best Schools (Quality) | The Plains States (Region) | #38 of 73 |
| Best Value | The Plains States (Region) | #47 of 70 |
| Best Schools (Quality) | Nationwide | #372 of 915 |
| Best Value | Nationwide | #573 of 928 |
Master’s-Level Rankings
| Ranking | Scope | Rank |
|---|---|---|
| Best Schools (Quality) | Missouri | #8 of 22 |
| Best Value | Missouri | #11 of 21 |
| Best Schools (Quality) | The Plains States (Region) | #38 of 73 |
| Best Value | The Plains States (Region) | #47 of 70 |
| Best Schools (Quality) | Nationwide | #372 of 915 |
| Best Value | Nationwide | #573 of 928 |
Earnings for Health/Medical Admin Services Graduates from Lindenwood University
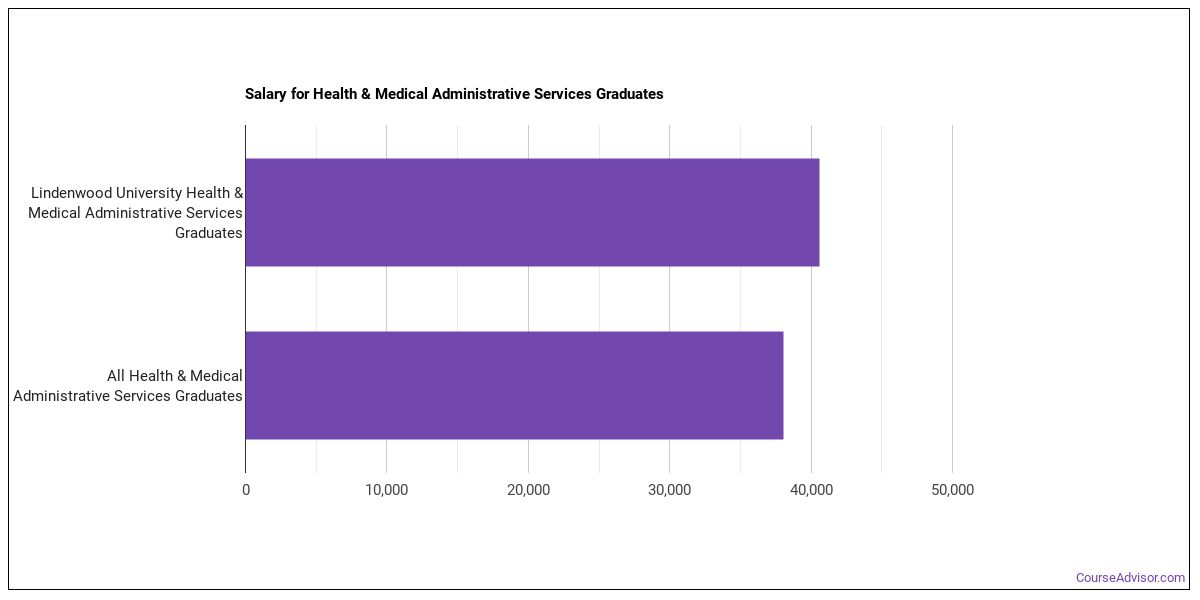
Students who complete Lindenwood University’s Health/Medical Admin Services program earn at the following median levels (per the U.S. Department of Education’s College Scorecard):
| Years After Graduation | Median Earnings |
|---|---|
| 1 year | $42,761 |
| 2 years | $44,717 |
| 3 years | $48,339 |
| 4 years | $56,969 |
| 5 years | $62,717 |
How does this compare to the school overall? Four years after graduating, Health/Medical Admin Services graduates from Lindenwood University earn a median of $56,969, compared with $51,541 for all Lindenwood University graduates — about 11% higher than the school-wide median.

Median Debt at Graduation
The median debt for Health/Medical Admin Services graduates from Lindenwood University stands at $35,500.
Student Demographics & Diversity
Below you’ll find the student demographics for Health/Medical Admin Services graduates at Lindenwood University, by degree type.
Across all degree levels, Health/Medical Admin Services graduates at Lindenwood University are 88% women (23) and 12% men (3).
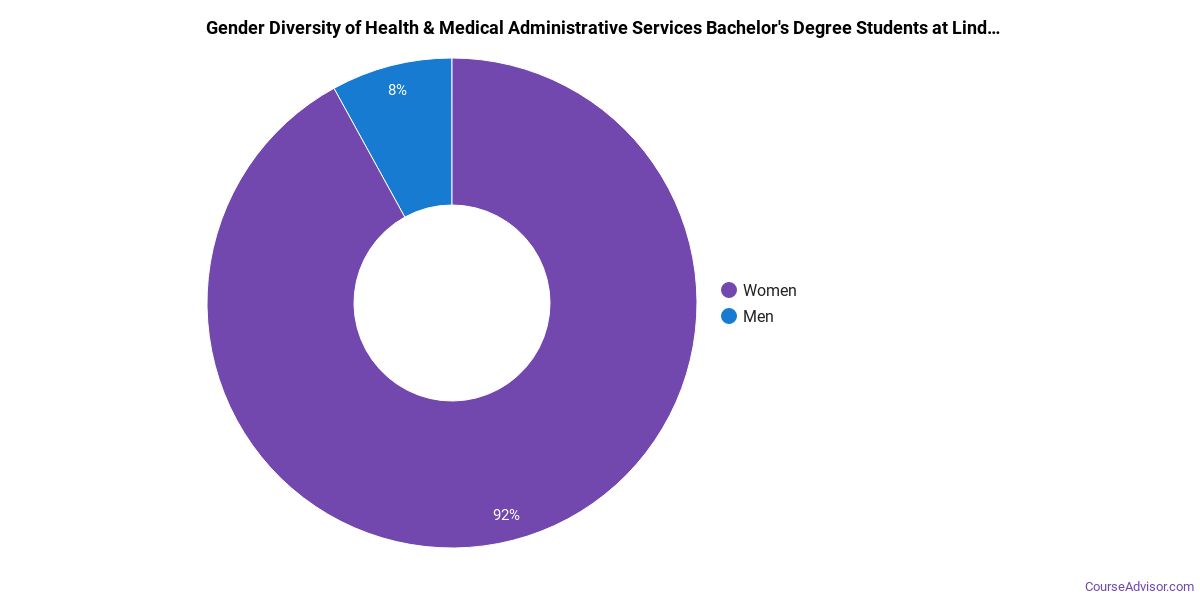
Health/Medical Admin Services Bachelor’s Program at Lindenwood University
Of the 12 bachelor’s health/medical admin services degrees awarded at Lindenwood University, 83% were women (10) and 17% were men (2).
The following table and chart show the race/ethnicity of Health/Medical Admin Services bachelor’s degree recipients at Lindenwood University.
| Race / Ethnicity | Number of Graduates |
|---|---|
| White | 4 |
| Black / African American | 5 |
| Two or More Races | 3 |
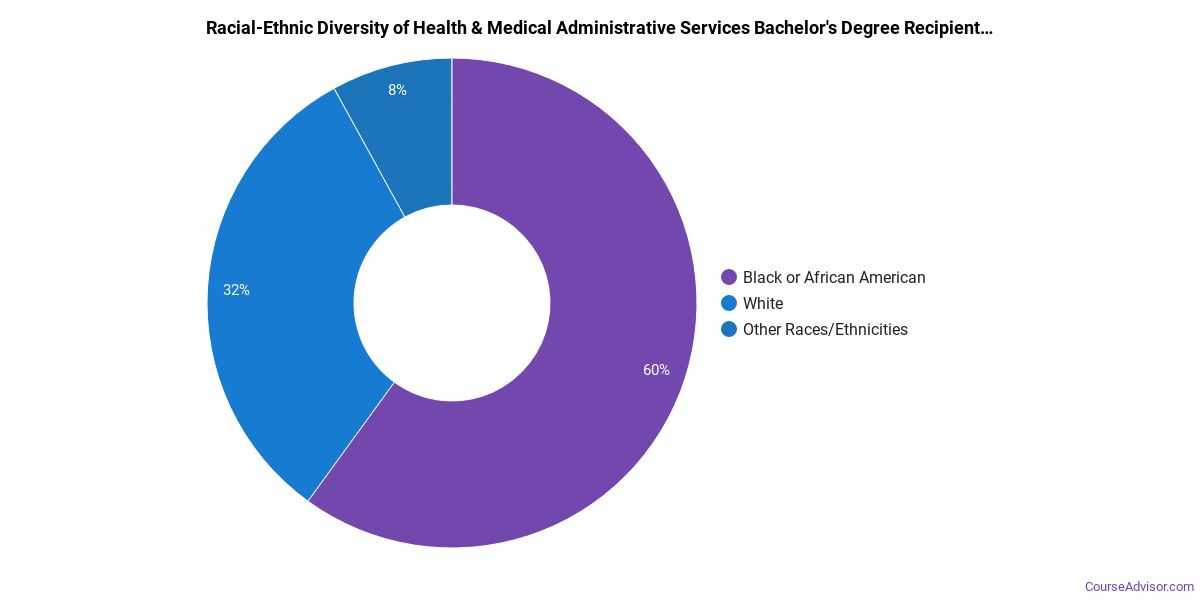
Minority students account for 67% of Health/Medical Admin Services bachelor’s degree recipients at Lindenwood University, above the national average of 51%.*
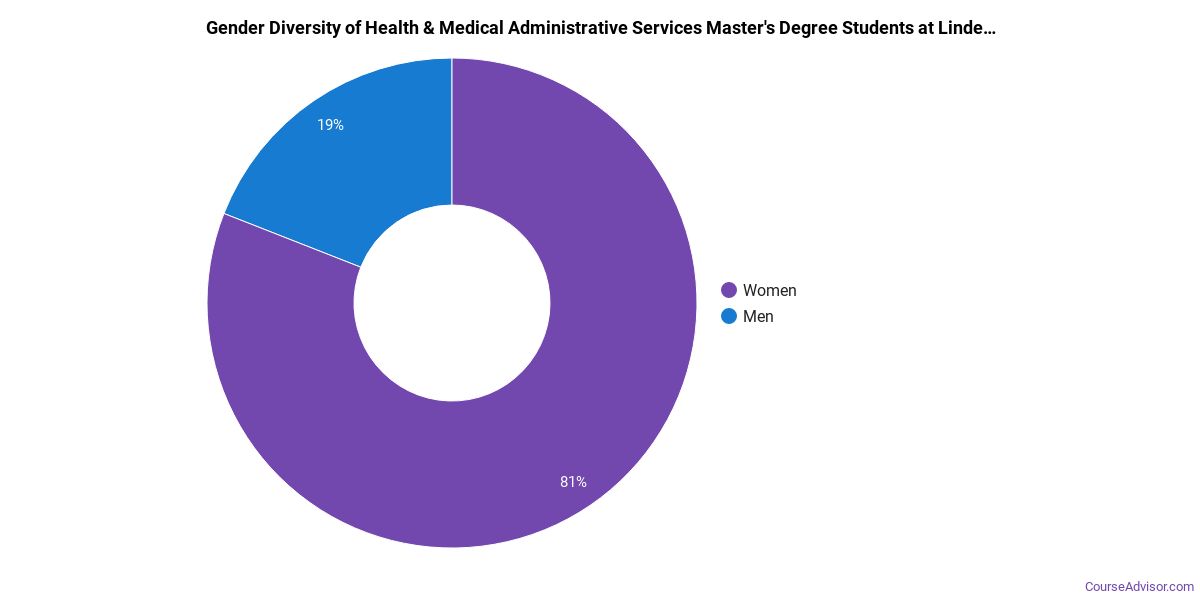
Health/Medical Admin Services Master’s Program at Lindenwood University
Of the 14 master’s health/medical admin services graduates at Lindenwood University, 93% were women (13) and 7% were men (1).
The following table and chart show the race/ethnicity of Health/Medical Admin Services master’s degree recipients at Lindenwood University.
| Race / Ethnicity | Number of Graduates |
|---|---|
| White | 6 |
| Hispanic / Latino | 2 |
| Black / African American | 3 |
| Two or More Races | 2 |
| Unknown | 1 |
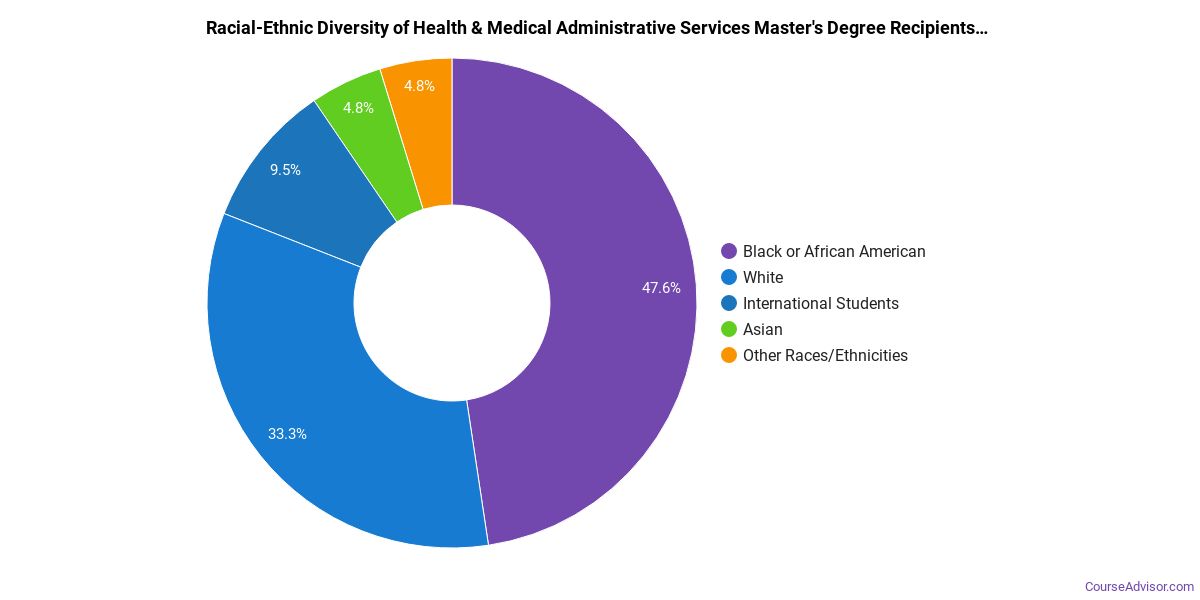
Racial-ethnic minorities make up 50% of Health/Medical Admin Services master’s degree recipients at Lindenwood University, higher than the national average of 45%.*
*The racial-ethnic minorities figure is the total number of graduates minus White, international (nonresident), and unknown-race graduates.
More Specific Health/Medical Admin Services Concentrations at Lindenwood University
This Health/Medical Admin Services program at Lindenwood University offers more specialized concentrations:
| Concentration | Graduates |
|---|---|
| Health Care Management | 26 |
Top-Paying Careers for Health/Medical Admin Services Graduates
Graduates of the Health/Medical Admin Services program at Lindenwood University work across a variety of fields. Here are the highest-paying careers for Health/Medical Admin Services majors, ordered by median annual salary:
| Occupation | Nationwide Median Wage |
|---|---|
| Loss Prevention Managers | $165,723 |
| Education Administrators, Postsecondary | $161,927 |
| Administrative Services Managers | $158,084 |
| Facilities Managers | $157,669 |
| Medical Records Specialists | $153,246 |
| Medical and Health Services Managers | $129,557 |
| Environmental Compliance Inspectors | $119,630 |
| Healthcare Practitioners and Technical Workers, All Other | $117,846 |
| Compliance Managers | $117,178 |
| Information Security Analysts | $111,930 |
References
- IPEDS — Integrated Postsecondary Education Data System
- U.S. Department of Education — College Scorecard
- O*NET Online (Bureau of Labor Statistics)
- National Center for Education Statistics
More about our data sources and methodologies.
Course Advisor provides higher-education, college and university, degree, program, career, salary, and other helpful information to students, faculty, institutions, and other internet audiences. Presented information and data are subject to change. Inclusion on this website does not imply or represent a direct relationship with the company, school, or brand. Information, though believed correct at time of publication, may not be correct, and no warranty is provided. Contact the schools to verify any information before relying on it. Financial aid may be available for those who qualify. The displayed options may include sponsored or recommended results, not necessarily based on your preferences.
© Course Advisor – All Rights Reserved.