Film, Video & Photographic Arts at Cornish College of the Arts
What traits are you looking for in a school for Film, Video & Photographic Arts, consider the program at Cornish College of the Arts. Get started with the following essential facts.
Cornish College of the Arts is located in Seattle, WA.
During the most recent reporting year, 7 film, video & photographic arts degrees were granted at Cornish College of the Arts.
Featured schools near , edit
Online & Distance Learning at Cornish College of the Arts
Distance learning is available at Cornish College of the Arts. Of 505 students, 0 (0%) studied exclusively online and 44 (9%) took at least some classes online.
Film, Video & Photographic Arts Rankings at Cornish College of the Arts
These rankings give you a sense of how Cornish College of the Arts’s Film, Video & Photographic Arts program to other colleges that offer this major.
Student Demographics & Diversity
The following sections describe the composition of Film, Video & Photographic Arts graduates at Cornish College of the Arts, by degree type.
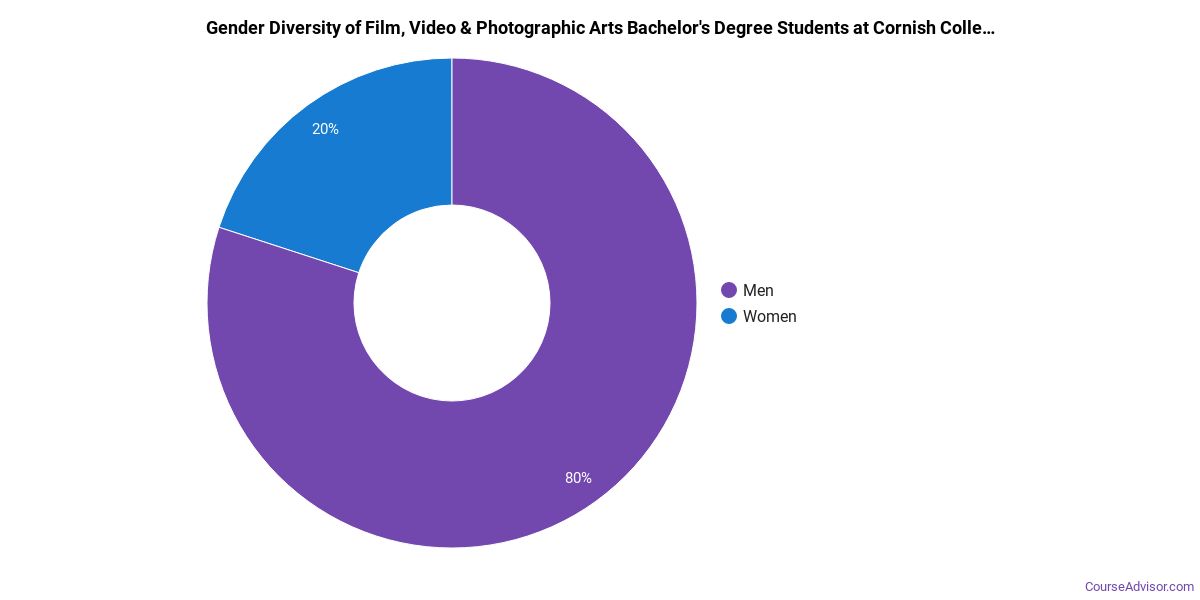
Across all degree levels, Film, Video & Photographic Arts graduates at Cornish College of the Arts are 29% women (2) and 71% men (5).
Film, Video & Photographic Arts Bachelor’s Program at Cornish College of the Arts
Of the 7 bachelor’s film, video & photographic arts graduates at Cornish College of the Arts, 29% were women (2) and 71% were men (5).
The following table and chart show the race/ethnicity of Film, Video & Photographic Arts bachelor’s degree recipients at Cornish College of the Arts.
| Race / Ethnicity | Number of Graduates |
|---|---|
| White | 3 |
| Asian | 1 |
| International (Nonresident) | 2 |
| Unknown | 1 |
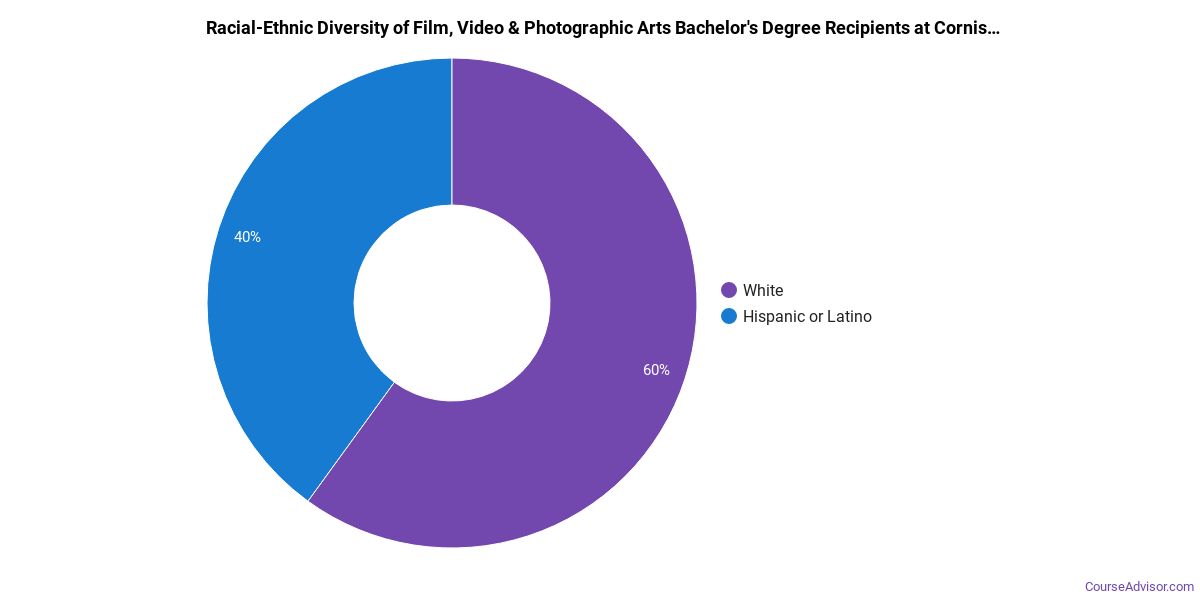
Racial-ethnic minorities make up 14% of Film, Video & Photographic Arts bachelor’s degree recipients at Cornish College of the Arts, below the national average of 40%.*
*The racial-ethnic minorities figure is the total number of graduates minus White, international (nonresident), and unknown-race graduates.
More Specific Film, Video & Photographic Arts Concentrations at Cornish College of the Arts
This Film, Video & Photographic Arts program at Cornish College of the Arts includes the following sub-specializations:
| Concentration | Graduates |
|---|---|
| Film & Video Production | 7 |
Best-Paid Careers for Film, Video & Photographic Arts Graduates
Students who finish Film, Video & Photographic Arts program at Cornish College of the Arts go on to a range of careers. Below are the top-paying careers for Film, Video & Photographic Arts graduates, ordered by median annual salary:
| Occupation | Nationwide Median Wage |
|---|---|
| Communications Teachers, Postsecondary | $96,169 |
| Camera Operators, Television, Video, and Film | $92,043 |
| Media Programming Directors | $90,799 |
| Producers and Directors | $90,515 |
| Film and Video Editors | $89,576 |
| Photographers | $75,743 |
| Talent Directors | $73,937 |
| Media Technical Directors/Managers | $65,049 |
| Art, Drama, and Music Teachers, Postsecondary | $46,983 |
References
- IPEDS — Integrated Postsecondary Education Data System
- U.S. Department of Education — College Scorecard
- O*NET Online (Bureau of Labor Statistics)
- National Center for Education Statistics
More about our data sources and methodologies.
Course Advisor provides higher-education, college and university, degree, program, career, salary, and other helpful information to students, faculty, institutions, and other internet audiences. Presented information and data are subject to change. Inclusion on this website does not imply or represent a direct relationship with the company, school, or brand. Information, though believed correct at time of publication, may not be correct, and no warranty is provided. Contact the schools to verify any information before relying on it. Financial aid may be available for those who qualify. The displayed options may include sponsored or recommended results, not necessarily based on your preferences.
© Course Advisor – All Rights Reserved.