Allied Health Professions at Concordia University-Saint Paul
If you are interested in studying Allied Health Professions, you may want to check out the program at Concordia University-Saint Paul. Get started with the following essential facts.
Concordia University-Saint Paul is in Saint Paul, MN.
In the most recent year for which we have data, 25 allied health professions degrees were granted at Concordia University-Saint Paul.
Featured schools near , edit
Studying Online at Concordia University-Saint Paul
Many students take online classes at Concordia University-Saint Paul. Among 6,003 students, 2,761 (46%) studied exclusively online and 2,355 (39%) took at least some classes online.
Allied Health Professions Rankings at Concordia University-Saint Paul
These rankings give you a sense of how Concordia University-Saint Paul’s Allied Health Professions program against other schools offering the same major.
Bachelor’s-Level Rankings
| Ranking | Scope | Rank |
|---|---|---|
| Best Schools (Quality) | Minnesota | #3 of 25 |
| Best Schools (Quality) | The Plains States (Region) | #8 of 114 |
| Best Value | Minnesota | #12 of 24 |
| Best Value | The Plains States (Region) | #69 of 107 |
| Best Schools (Quality) | Nationwide | #149 of 1,196 |
| Best Value | Nationwide | #745 of 1,196 |
Associate-Level Rankings
| Ranking | Scope | Rank |
|---|---|---|
| Best Schools (Quality) | Minnesota | #3 of 25 |
| Best Schools (Quality) | The Plains States (Region) | #8 of 114 |
| Best Value | Minnesota | #12 of 24 |
| Best Value | The Plains States (Region) | #69 of 107 |
| Best Schools (Quality) | Nationwide | #149 of 1,196 |
| Best Value | Nationwide | #745 of 1,196 |
Student Demographics & Diversity
The following sections describe the composition of Allied Health Professions graduates at Concordia University-Saint Paul, broken down by degree level.
Across all degree levels, Allied Health Professions graduates at Concordia University-Saint Paul are 84% women (21) and 16% men (4).
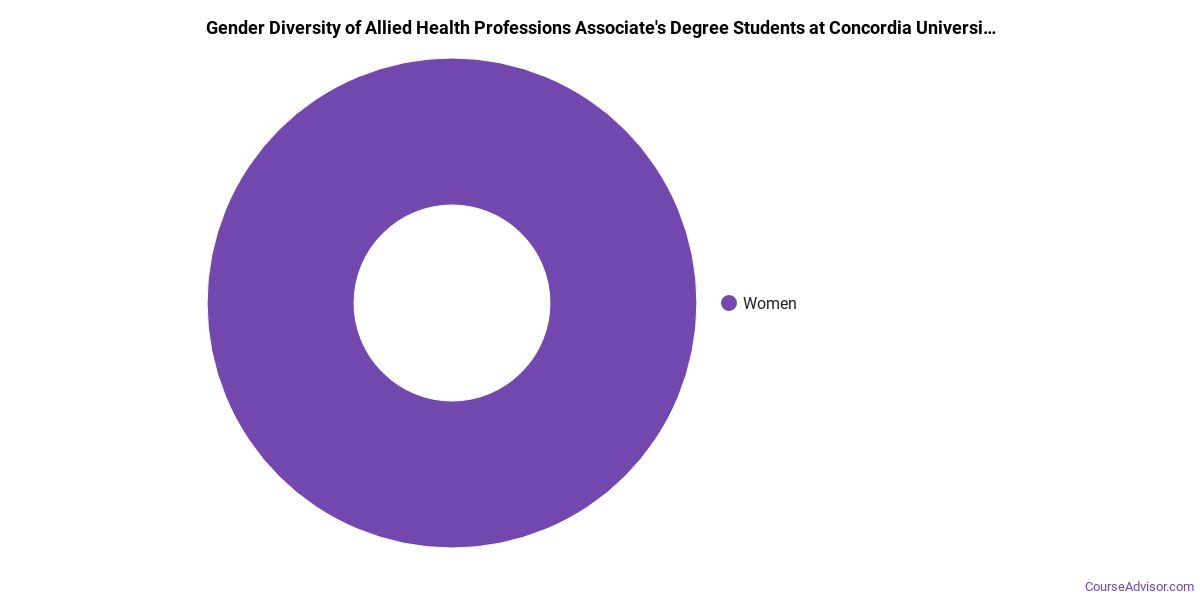
Allied Health Professions Associate’s Program at Concordia University-Saint Paul
Among the 23 associate’s allied health professions degrees awarded at Concordia University-Saint Paul, 87% were women (20) and 13% were men (3).
The following table and chart show the race/ethnicity of Allied Health Professions associate’s degree recipients at Concordia University-Saint Paul.
| Race / Ethnicity | Number of Graduates |
|---|---|
| White | 14 |
| Hispanic / Latino | 1 |
| Black / African American | 4 |
| Asian | 3 |
| Two or More Races | 1 |
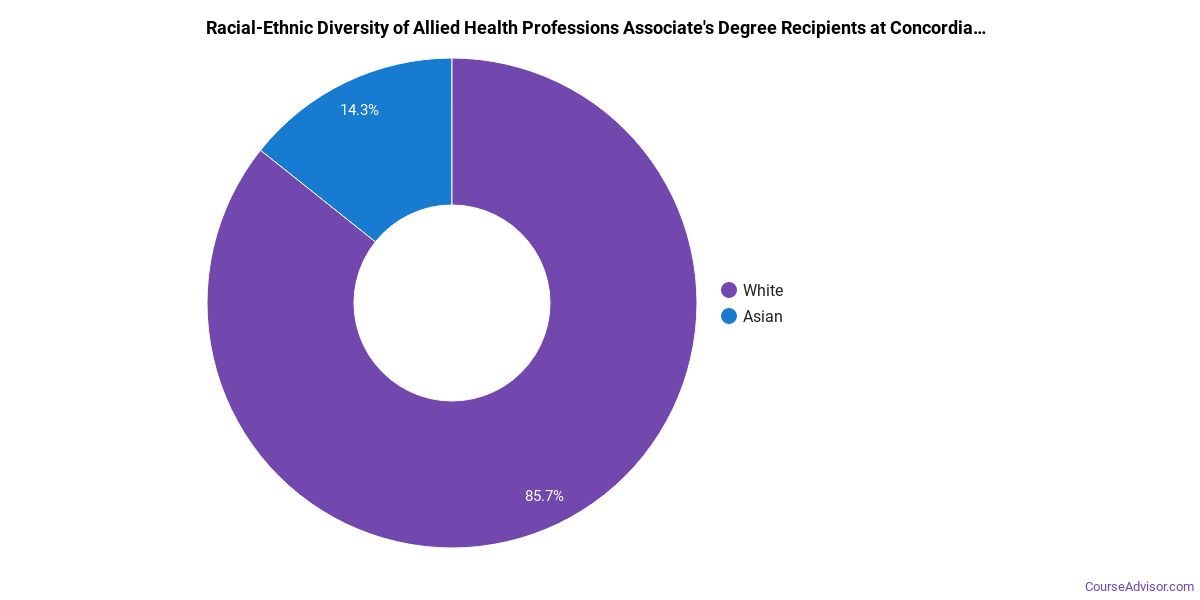
Racial-ethnic minorities make up 39% of Allied Health Professions associate’s degree recipients at Concordia University-Saint Paul, lower than the national average of 45%.*
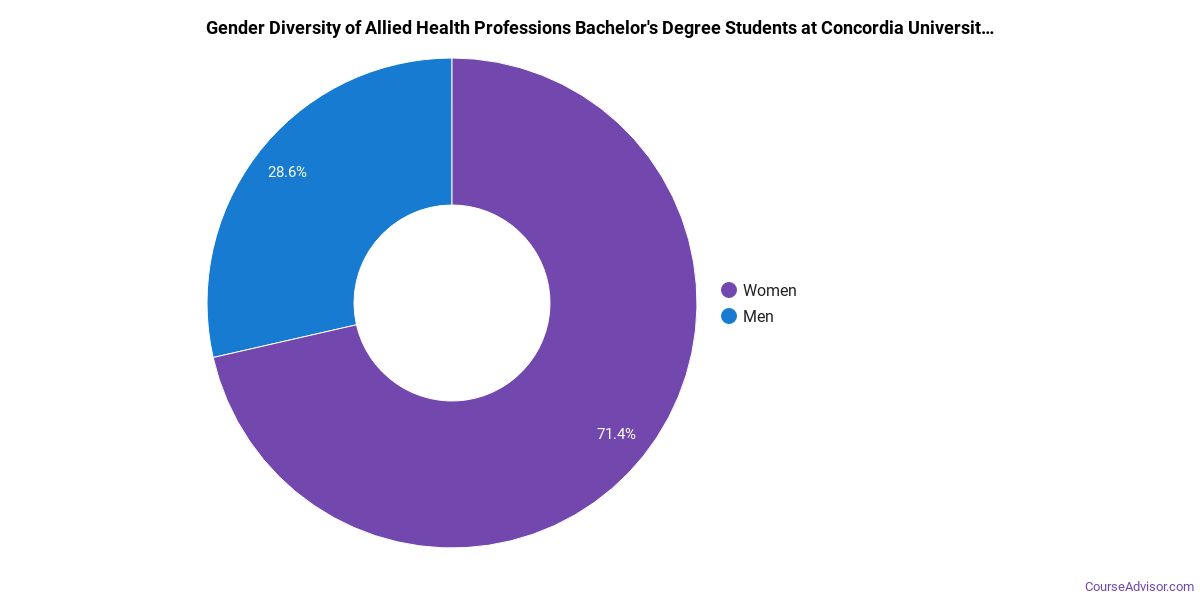
Allied Health Professions Bachelor’s Program at Concordia University-Saint Paul
Of the 2 bachelor’s allied health professions graduates at Concordia University-Saint Paul, 50% were women (1) and 50% were men (1).
The following table and chart show the race/ethnicity of Allied Health Professions bachelor’s degree recipients at Concordia University-Saint Paul.
| Race / Ethnicity | Number of Graduates |
|---|---|
| White | 1 |
| Black / African American | 1 |
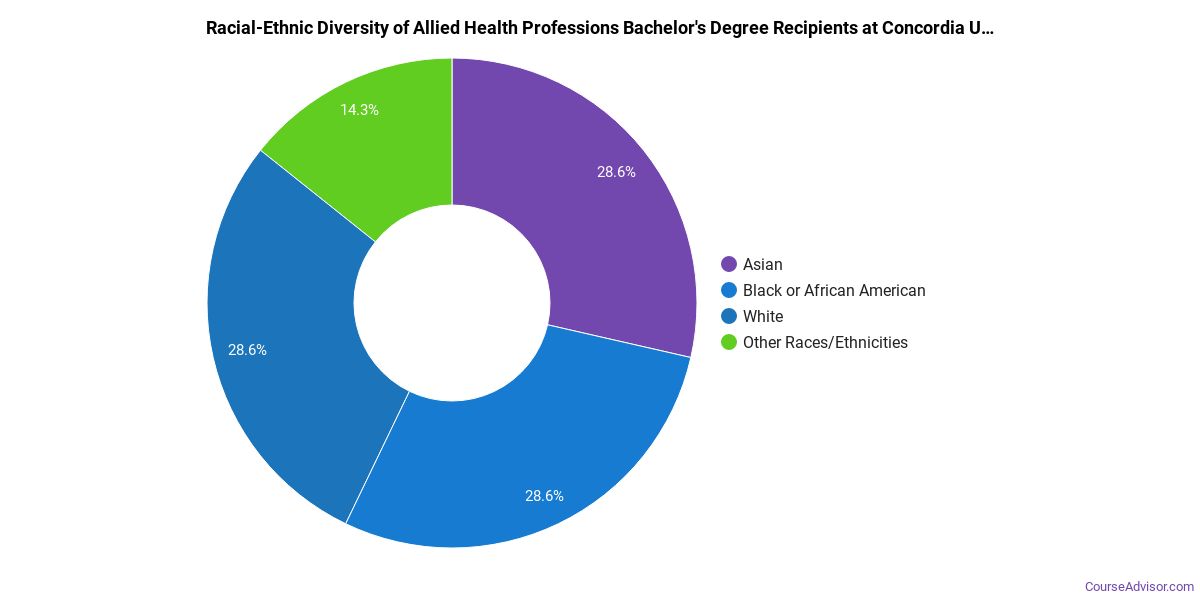
Minority students account for 50% of Allied Health Professions bachelor’s degree recipients at Concordia University-Saint Paul, above the national average of 33%.*
*The racial-ethnic minorities figure is the total number of graduates minus White, international (nonresident), and unknown-race graduates.
More Specific Allied Health Professions Concentrations at Concordia University-Saint Paul
This Allied Health Professions program at Concordia University-Saint Paul offers more specialized concentrations:
| Concentration | Graduates |
|---|---|
| Respiratory Care Therapy | 1 |
| Sonographer/Ultrasound Technology | 23 |
| Athletic Training | 1 |
Highest-Paying Careers for Allied Health Professions Graduates
Students who finish Allied Health Professions program at Concordia University-Saint Paul go on to a range of careers. The table below ranks the top-paying careers for Allied Health Professions graduates, ordered by median annual salary:
| Occupation | Nationwide Median Wage |
|---|---|
| Health Technologists and Technicians, All Other | $153,940 |
| Ophthalmic Medical Technologists | $153,819 |
| Surgical Assistants | $141,004 |
| Radiologic Technologists and Technicians | $137,802 |
| Respiratory Therapists | $128,345 |
| Nuclear Medicine Technologists | $119,042 |
| Anesthesiologist Assistants | $116,229 |
| Nuclear Monitoring Technicians | $115,968 |
| Emergency Medical Technicians | $105,175 |
| Hearing Aid Specialists | $96,168 |
References
- IPEDS — Integrated Postsecondary Education Data System
- U.S. Department of Education — College Scorecard
- O*NET Online (Bureau of Labor Statistics)
- National Center for Education Statistics
More about our data sources and methodologies.
Course Advisor provides higher-education, college and university, degree, program, career, salary, and other helpful information to students, faculty, institutions, and other internet audiences. Presented information and data are subject to change. Inclusion on this website does not imply or represent a direct relationship with the company, school, or brand. Information, though believed correct at time of publication, may not be correct, and no warranty is provided. Contact the schools to verify any information before relying on it. Financial aid may be available for those who qualify. The displayed options may include sponsored or recommended results, not necessarily based on your preferences.
© Course Advisor – All Rights Reserved.