Design & Applied Arts at Clover Park Technical College
What traits are you looking for in a school for Design & Applied Arts, you may want to check out the program at Clover Park Technical College. The following information will help you decide if it is a good fit for you.
Clover Park Technical College sits in Lakewood, WA.
For the most recent IPEDS reporting year, 32 design & applied arts degrees were granted at Clover Park Technical College.
Featured schools near , edit
Online & Distance Learning at Clover Park Technical College
Online coursework is an option at Clover Park Technical College. Of 3,408 students, 407 (12%) were enrolled entirely in distance education and 821 (24%) took at least some classes online.
Student Demographics & Diversity
Below you’ll find the student demographics for Design & Applied Arts graduates at Clover Park Technical College, broken down by degree level.
Looking at the program as a whole, Design & Applied Arts graduates at Clover Park Technical College are 75% women (24) and 25% men (8).
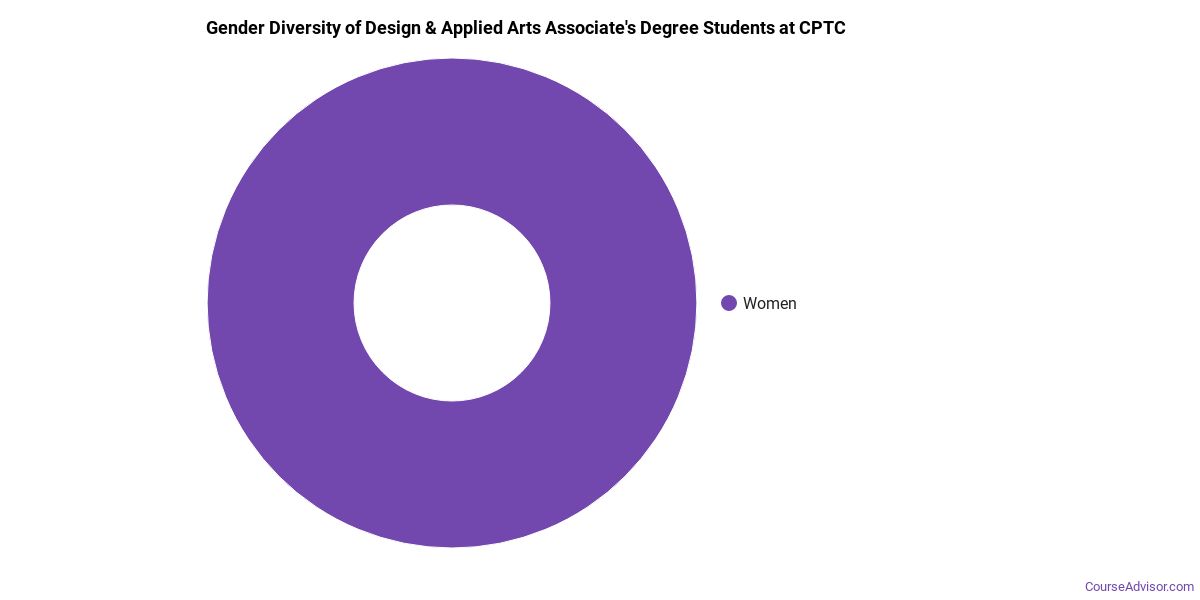
Design & Applied Arts Associate’s Program at Clover Park Technical College
Of the 17 associate’s design & applied arts graduates at Clover Park Technical College, 76% were women (13) and 24% were men (4).
The following table and chart show the race/ethnicity of Design & Applied Arts associate’s degree recipients at Clover Park Technical College.
| Race / Ethnicity | Number of Graduates |
|---|---|
| White | 8 |
| Hispanic / Latino | 3 |
| Black / African American | 1 |
| Asian | 1 |
| International (Nonresident) | 1 |
| Unknown | 3 |
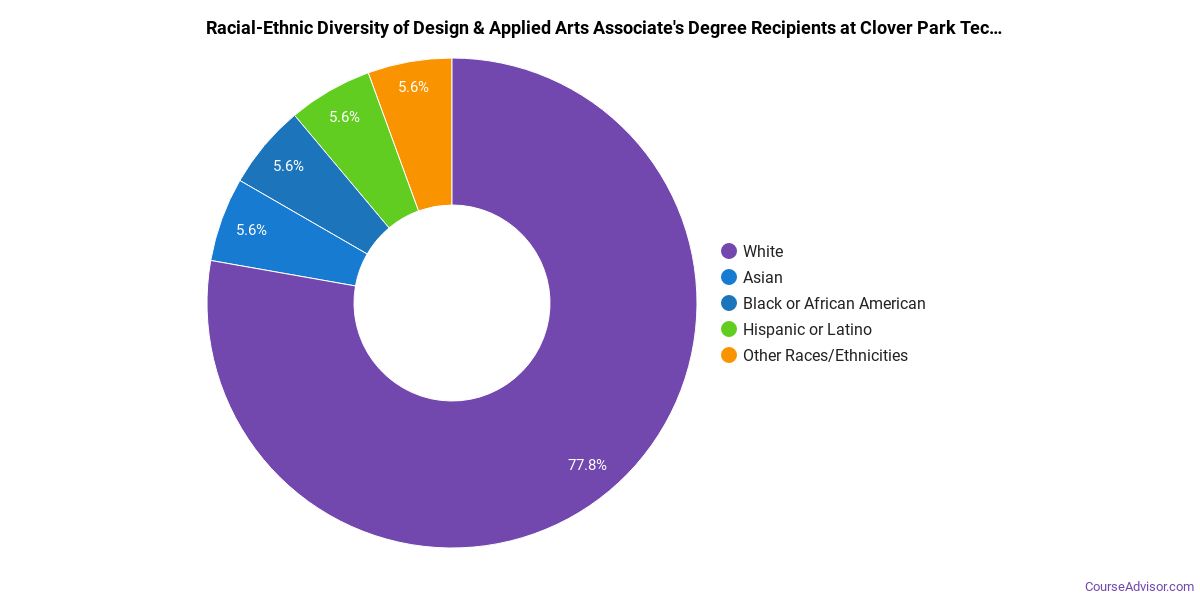
Minority students account for 29% of Design & Applied Arts associate’s degree recipients at Clover Park Technical College, lower than the national average of 43%.*
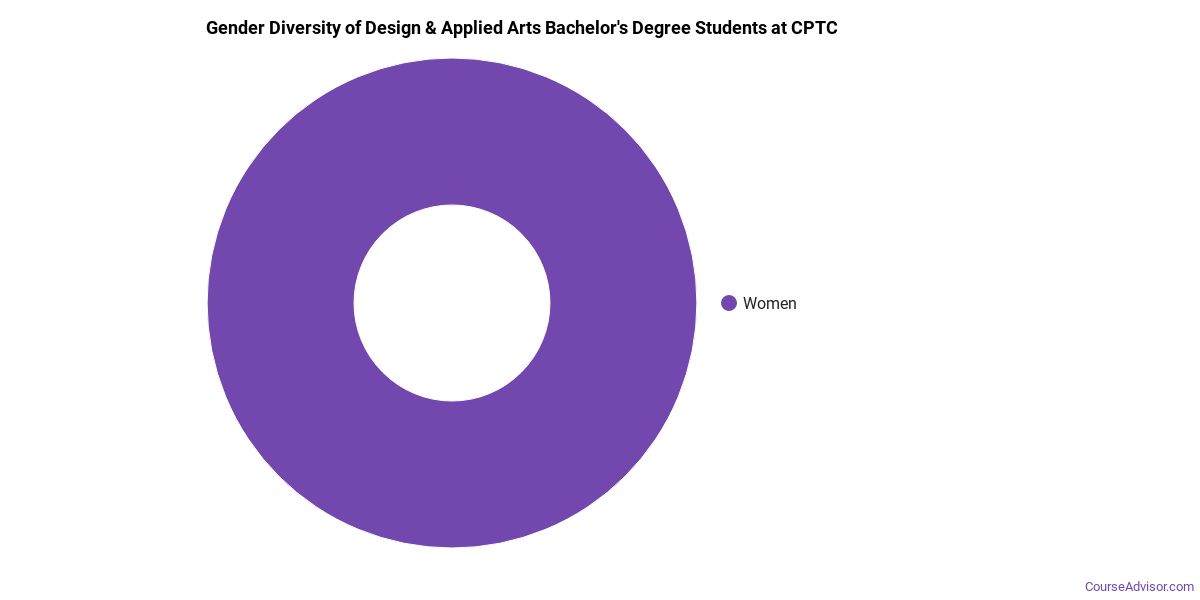
Design & Applied Arts Bachelor’s Program at Clover Park Technical College
Of the 10 bachelor’s design & applied arts graduates at Clover Park Technical College, 70% were women (7) and 30% were men (3).
The following table and chart show the race/ethnicity of Design & Applied Arts bachelor’s degree recipients at Clover Park Technical College.
| Race / Ethnicity | Number of Graduates |
|---|---|
| White | 9 |
| Hispanic / Latino | 1 |
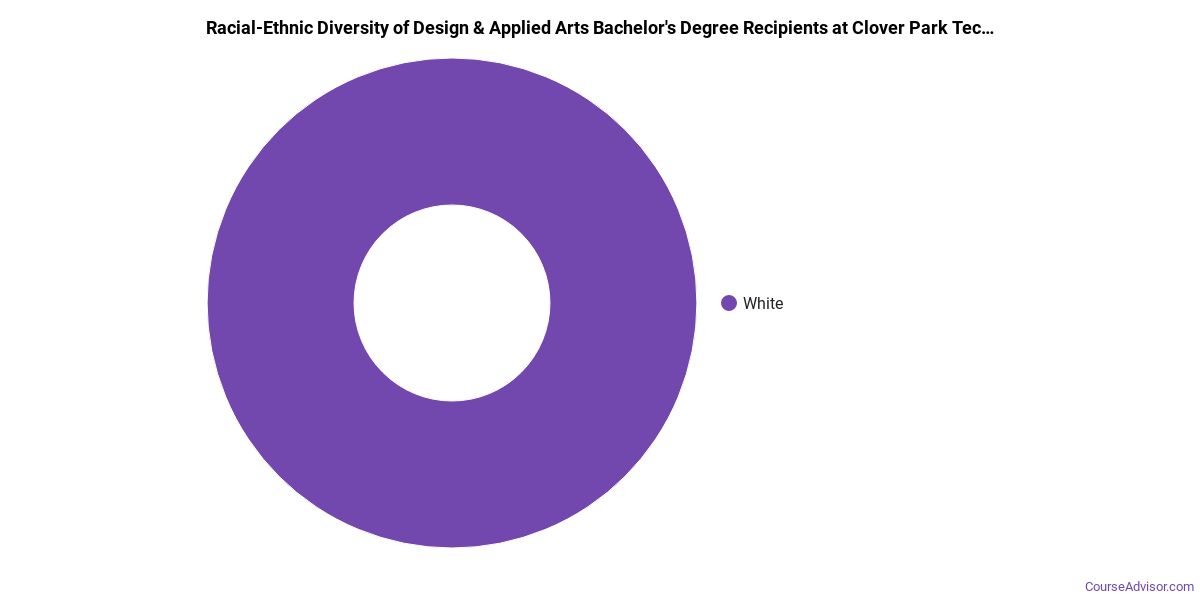
Racial-ethnic minorities make up 10% of Design & Applied Arts bachelor’s degree recipients at Clover Park Technical College, lower than the national average of 37%.*
*The racial-ethnic minorities figure is the total number of graduates minus White, international (nonresident), and unknown-race graduates.
More Specific Design & Applied Arts Concentrations at Clover Park Technical College
This Design & Applied Arts program at Clover Park Technical College includes the following sub-specializations:
| Concentration | Graduates |
|---|---|
| Interior Design | 32 |
Best-Paid Careers for Design & Applied Arts Graduates
Those who complete Design & Applied Arts program at Clover Park Technical College work across a variety of fields. The table below ranks the top-paying careers for Design & Applied Arts graduates, ordered by median annual salary:
| Occupation | Nationwide Median Wage |
|---|---|
| Set and Exhibit Designers | $109,049 |
| Art Directors | $103,285 |
| Web and Digital Interface Designers | $88,198 |
| Artists and Related Workers, All Other | $83,610 |
| Photographers | $75,743 |
| Designers, All Other | $73,407 |
| Postsecondary Teachers, All Other | $68,967 |
| Architecture Teachers, Postsecondary | $66,757 |
| Graphic Designers | $66,386 |
| Video Game Designers | $62,617 |
References
- IPEDS — Integrated Postsecondary Education Data System
- U.S. Department of Education — College Scorecard
- O*NET Online (Bureau of Labor Statistics)
- National Center for Education Statistics
More about our data sources and methodologies.
Course Advisor provides higher-education, college and university, degree, program, career, salary, and other helpful information to students, faculty, institutions, and other internet audiences. Presented information and data are subject to change. Inclusion on this website does not imply or represent a direct relationship with the company, school, or brand. Information, though believed correct at time of publication, may not be correct, and no warranty is provided. Contact the schools to verify any information before relying on it. Financial aid may be available for those who qualify. The displayed options may include sponsored or recommended results, not necessarily based on your preferences.
© Course Advisor – All Rights Reserved.