Business Administration & Management at Case Western Reserve University
If you plan to study Business Administration & Management, you may want to check out the program at Case Western Reserve University. Get started with the following essential facts.
Case Western Reserve University is located in Cleveland, OH.
For the most recent IPEDS reporting year, 189 business administration & management graduations were recorded at Case Western Reserve University.
Featured schools near , edit
Studying Online at Case Western Reserve University
Distance learning is available at Case Western Reserve University. Among 12,475 students, 503 (4%) were enrolled entirely in distance education and 1,512 (12%) took at least some classes online.
Student Demographics & Diversity
The following sections describe the composition of Business Administration & Management graduates at Case Western Reserve University, by degree type.
Program-wide, Business Administration & Management graduates at Case Western Reserve University are 46% women (86) and 54% men (103).
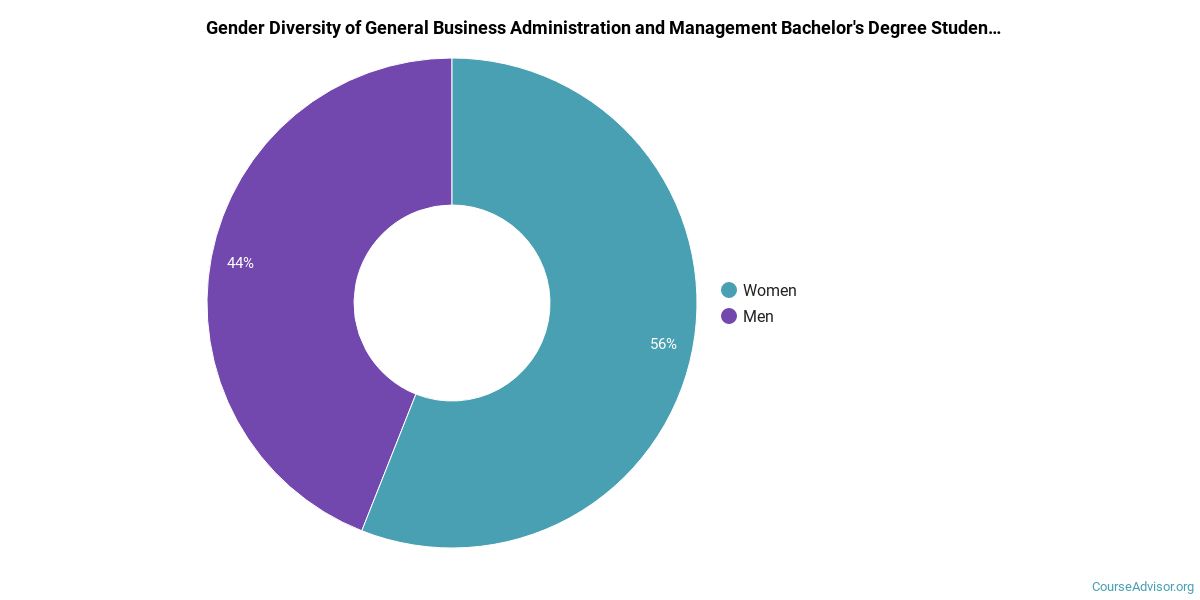
Business Administration & Management Bachelor’s Program at Case Western Reserve University
Among the 55 bachelor’s business administration & management graduates at Case Western Reserve University, 44% were women (24) and 56% were men (31).
The following table and chart show the race/ethnicity of Business Administration & Management bachelor’s degree recipients at Case Western Reserve University.
| Race / Ethnicity | Number of Graduates |
|---|---|
| White | 17 |
| Hispanic / Latino | 6 |
| Black / African American | 2 |
| Asian | 20 |
| Two or More Races | 2 |
| International (Nonresident) | 8 |

Racial-ethnic minorities make up 55% of Business Administration & Management bachelor’s degree recipients at Case Western Reserve University, above the national average of 42%.*
Business Administration & Management Master’s Program at Case Western Reserve University
Among the 122 master’s business administration & management graduates at Case Western Reserve University, 46% were women (56) and 54% were men (66).

The following table and chart show the race/ethnicity of Business Administration & Management master’s degree recipients at Case Western Reserve University.
| Race / Ethnicity | Number of Graduates |
|---|---|
| White | 70 |
| Hispanic / Latino | 9 |
| Black / African American | 6 |
| Asian | 7 |
| Two or More Races | 1 |
| International (Nonresident) | 24 |
| Unknown | 5 |

Minority students account for 19% of Business Administration & Management master’s degree recipients at Case Western Reserve University, below the national average of 36%.*
Business Administration & Management Doctoral Program at Case Western Reserve University
Among the 12 doctoral business administration & management graduates at Case Western Reserve University, 50% were women (6) and 50% were men (6).

The following table and chart show the race/ethnicity of Business Administration & Management doctoral degree recipients at Case Western Reserve University.
| Race / Ethnicity | Number of Graduates |
|---|---|
| White | 2 |
| Black / African American | 2 |
| Asian | 1 |
| Two or More Races | 1 |
| International (Nonresident) | 3 |
| Unknown | 3 |

Minority students account for 33% of Business Administration & Management doctoral degree recipients at Case Western Reserve University, lower than the national average of 38%.*
*The racial-ethnic minorities figure is the total number of graduates minus White, international (nonresident), and unknown-race graduates.
Highest-Paying Careers for Business Administration & Management Graduates
Graduates of the Business Administration & Management program at Case Western Reserve University pursue many career paths. The table below ranks the best-paid careers for Business Administration & Management graduates, ordered by median annual salary:
| Occupation | Nationwide Median Wage |
|---|---|
| Personal Service Managers, All Other | $176,674 |
| Loss Prevention Managers | $165,723 |
| Geothermal Production Managers | $160,381 |
| Administrative Services Managers | $158,084 |
| Facilities Managers | $157,669 |
| Biomass Power Plant Managers | $146,025 |
| Training and Development Managers | $139,524 |
| Chief Executives | $138,534 |
| Supply Chain Managers | $138,103 |
| Security Management Specialists | $128,654 |
References
- IPEDS — Integrated Postsecondary Education Data System
- U.S. Department of Education — College Scorecard
- O*NET Online (Bureau of Labor Statistics)
- National Center for Education Statistics
More about our data sources and methodologies.
Course Advisor provides higher-education, college and university, degree, program, career, salary, and other helpful information to students, faculty, institutions, and other internet audiences. Presented information and data are subject to change. Inclusion on this website does not imply or represent a direct relationship with the company, school, or brand. Information, though believed correct at time of publication, may not be correct, and no warranty is provided. Contact the schools to verify any information before relying on it. Financial aid may be available for those who qualify. The displayed options may include sponsored or recommended results, not necessarily based on your preferences.
© Course Advisor – All Rights Reserved.