Statisticians in Illinois
Thinking about a career as a Statisticians in Illinois? Here’s what the data says. Develop or apply mathematical or statistical theory and methods to collect, organize, interpret, and summarize numerical data to provide usable information. May specialize in fields such as biostatistics, agricultural statistics, business statistics, or economic statistics. Includes mathematical and survey statisticians. Excludes “Survey Researchers” (19-3022).
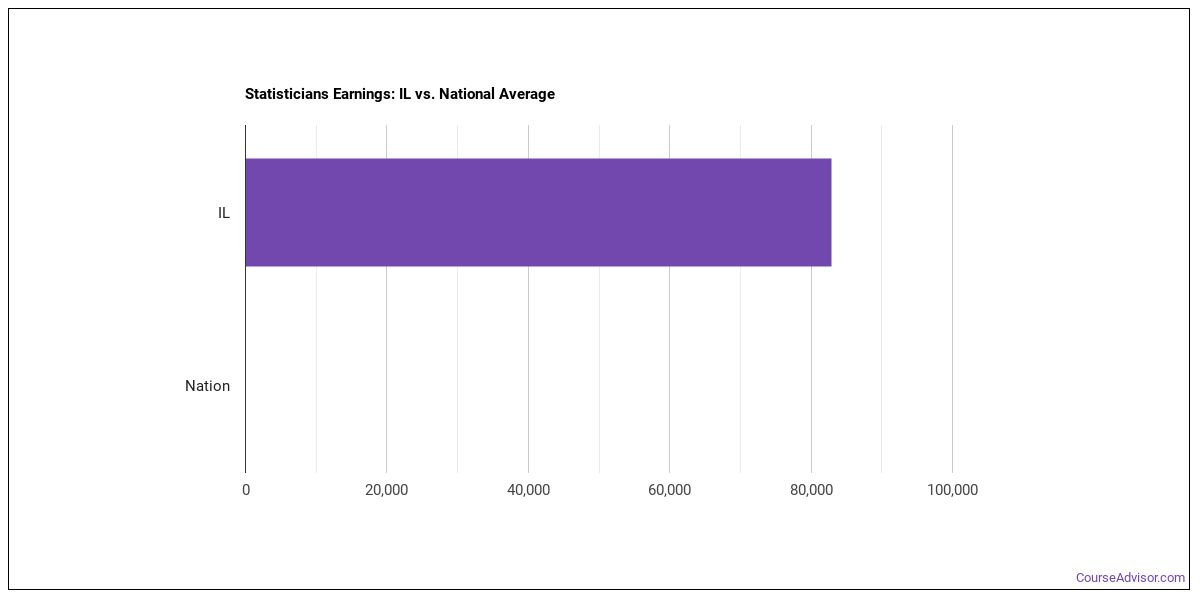
What do Statisticians Make in Illinois?
For statisticians working in Illinois, the median annual wage is $116,860 per year (or roughly $56.18/hour).Pay can range from $80,970 at the 10th percentile to $168,230 at the 90th percentile.
| Wage Statistic | Annual | Hourly |
|---|---|---|
| 10th percentile | $80,970 | $38.93 |
| 25th percentile | $98,390 | $47.30 |
| Median (50th) | $116,860 | $56.18 |
| 75th percentile | $145,500 | $69.95 |
| 90th percentile | $168,230 | $80.88 |

Location quotient — how concentrated this career is in Illinois relative to the national average — is 0.42, meaning fewer statisticians per worker than the national average.
National Wage Comparison
Nationally, statisticians earn a median of $130,349 per year ($62.67/hour), below the Illinois median.
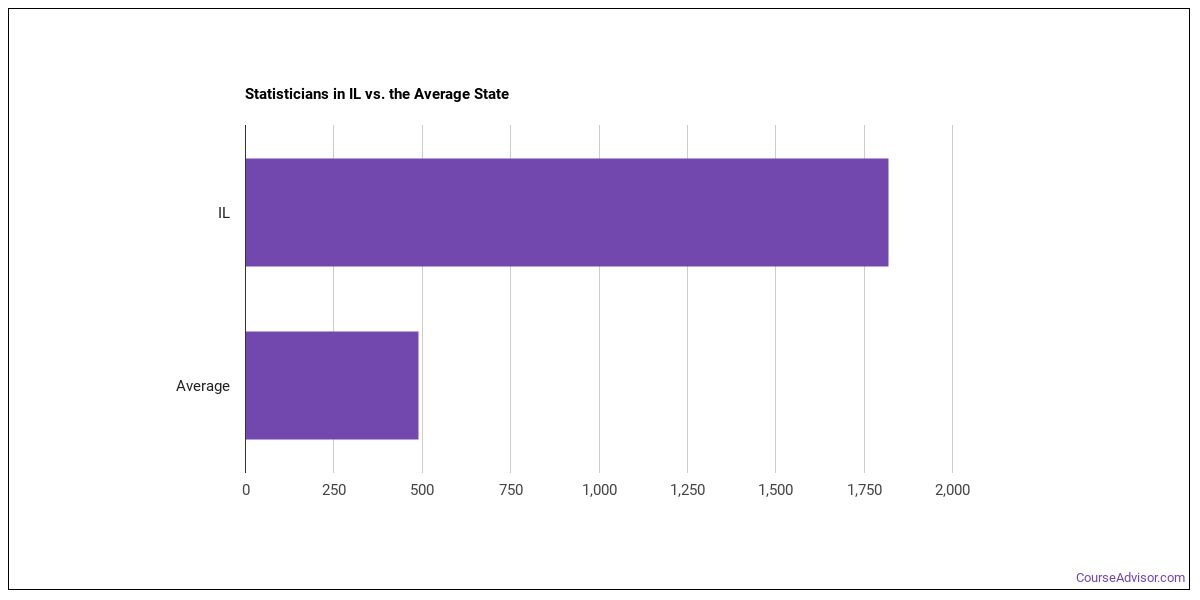
Employment Outlook
There are roughly 288,175 statisticians in the U.S.. In Illinois alone, around 490 people work in this role. That’s more than the typical state, which employs around 360 statisticians.

Top Illinois Metros for Statisticians
These are the Illinois metros with the most statisticians in Illinois.
| Metro Area | Number Employed | Annual Median Salary |
|---|---|---|
| Chicago-Naperville-Elgin, IL-IN | 370 | $119,200 |
Top States for Statisticians Employment
These states have the highest employment of statisticians work.
| State | Number Employed |
|---|---|
| Maryland | 3,070 |
| California | 2,810 |
| Washington | 2,520 |
| Pennsylvania | 2,190 |
| Massachusetts | 1,990 |
| New York | 1,490 |
| North Carolina | 1,430 |
| Texas | 1,210 |
| Minnesota | 1,010 |
| Colorado | 920 |
| Tennessee | 800 |
| Virginia | 800 |
| Florida | 620 |
| Oregon | 610 |
| District of Columbia | 610 |
| Michigan | 590 |
| New Jersey | 550 |
| Georgia | 550 |
| Missouri | 550 |
| Illinois | 490 |
Highest-Paying States for Statisticians
These states pay the most for statisticians.
| State | Annual Median Salary |
|---|---|
| New York | $150,240 |
| District of Columbia | $133,680 |
| Maryland | $128,940 |
| New Hampshire | $127,870 |
| California | $127,550 |
| Delaware | $126,640 |
| North Carolina | $122,630 |
| Illinois | $116,860 |
| Indiana | $113,030 |
| Georgia | $108,280 |
Skills
The most important statisticians skills, rated on an importance scale of 0 to 5:
Knowledge Areas
Core knowledge areas for this occupation, rated on an importance scale of 0 to 5:
Abilities
Top abilities for statisticians, rated on an importance scale of 0 to 5:
Daily Tasks
Common tasks include:
- Analyze and interpret statistical data to identify significant differences in relationships among sources of information.
- Evaluate the statistical methods and procedures used to obtain data to ensure validity, applicability, efficiency, and accuracy.
- Report results of statistical analyses, including information in the form of graphs, charts, and tables.
- Determine whether statistical methods are appropriate, based on user needs or research questions of interest.
- Prepare data for processing by organizing information, checking for inaccuracies, and adjusting and weighting the raw data.
- Develop and test experimental designs, sampling techniques, and analytical methods.
- Identify relationships and trends in data, as well as any factors that could affect the results of research.
- Present statistical and nonstatistical results, using charts, bullets, and graphs, in meetings or conferences to audiences such as clients, peers, and students.
- Design research projects that apply valid scientific techniques, and use information obtained from baselines or historical data to structure uncompromised and efficient analyses.
- Adapt statistical methods to solve specific problems in many fields, such as economics, biology, and engineering.
- Evaluate sources of information to determine any limitations, in terms of reliability or usability.
- Process large amounts of data for statistical modeling and graphic analysis, using computers.
Work Activities
- Analyzing Data or Information
- Working with Computers
- Processing Information
- Interpreting the Meaning of Information for Others
- Making Decisions and Solving Problems
- Getting Information
- Communicating with Supervisors, Peers, or Subordinates
- Updating and Using Relevant Knowledge
- Documenting/Recording Information
- Thinking Creatively
- Providing Consultation and Advice to Others
- Evaluating Information to Determine Compliance with Standards
Tools & Technology
Common tools and software used in this occupation include: Hot technologies: Amazon Redshift, Amazon Web Services AWS software, Apache Hadoop, Apache Spark In-demand technologies: Amazon Web Services AWS software, IBM SPSS Statistics
What Major Will Prepare You For This Career?
Related college programs include:
- Mathematics
- Statistics
- Applied Mathematics
- Applied Statistics
- Economics
- General Social Sciences
- Data Analytics
- Data Science
- Mathematical Economics
- Management Sciences & Methods
- Biomathematics & Bioinformatics
- Ecology & Systematics Biology
- Educational Assessment
- Child Development & Psychology
Featured schools near , edit
Related Careers
Careers similar to statisticians include:
- Management Analysts
- Financial Quantitative Analysts
- Computer and Information Research Scientists
- Database Architects
- Geographic Information Systems Technologists and Technicians
- Mathematicians
Also Known As
Analytical Statistician, Applied Scientist, Applied Statistician, Biometrician, Clinical Analyst, Data Analyst, Data Analyst Specialist, Data Analytics Specialist, Data Coordinator, Data Engineer, Data Manager, Data Modeler, Data Science Specialist, Data Specialist, Data Support Specialist.
References
- U.S. Bureau of Labor Statistics, Occupational Employment and Wage Statistics — https://www.bls.gov/oes/
- O*NET Online — https://www.onetonline.org/
- BLS Employment Projections — https://www.bls.gov/emp/
- O*NET-SOC code: 15-2041.00
Course Advisor provides higher-education, college and university, degree, program, career, salary, and other helpful information to students, faculty, institutions, and other internet audiences. Presented information and data are subject to change. Inclusion on this website does not imply or represent a direct relationship with the company, school, or brand. Information, though believed correct at time of publication, may not be correct, and no warranty is provided. Contact the schools to verify any information before relying on it. Financial aid may be available for those who qualify. The displayed options may include sponsored or recommended results, not necessarily based on your preferences.
© Course Advisor – All Rights Reserved.