Protective Service Workers, All Other in Virginia
Want to work as a Protective Service Workers, All Other in Virginia? Here’s what the data says. All protective service workers not listed separately.
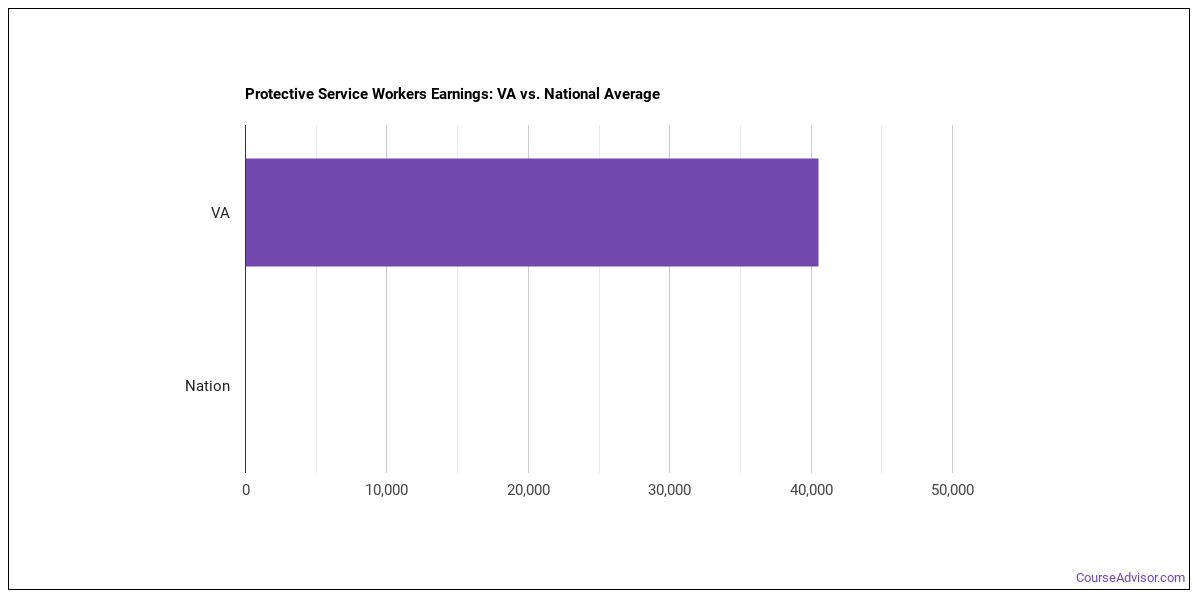
What do Protective Service Workers, All Other Make in Virginia?
For a protective service workers, all other working in Virginia, the typical annual salary is $32,080 per year (or about $15.42/hour).Annual wages span from $26,070 at the 10th percentile to $82,480 at the 90th percentile.
| Wage Statistic | Annual | Hourly |
|---|---|---|
| 10th percentile | $26,070 | $12.54 |
| 25th percentile | $26,820 | $12.89 |
| Median (50th) | $32,080 | $15.42 |
| 75th percentile | $46,360 | $22.29 |
| 90th percentile | $82,480 | $39.65 |

The location quotient — a measure of how concentrated this occupation is in Virginia relative to the national average — is 2.36, meaning that protective service workers, all other are more concentrated here than the national average.
National Wage Comparison
Nationally, protective service workers, all other earn a median of $65,495 per year ($31.49/hour), below the Virginia median.
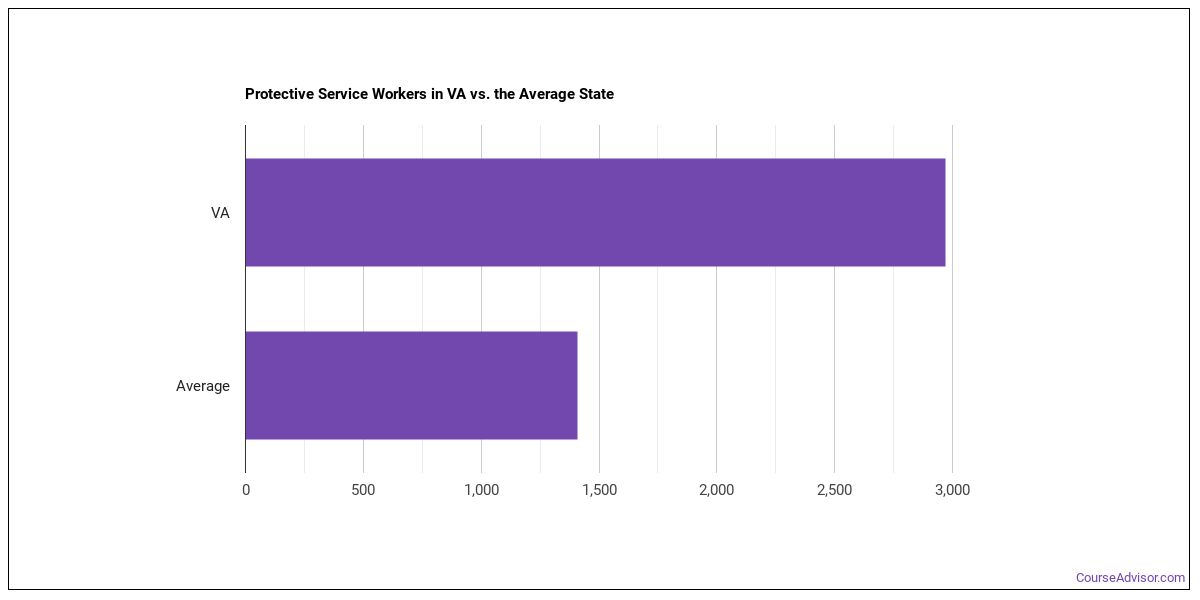
Employment Outlook
There are roughly 411,895 protective service workers, all other nationwide. In Virginia alone, about 5,170 people work in this role. That’s higher than the typical state, which employs around 570 protective service workers, all other.

Top Virginia Metros for Protective Service Workers, All Other
The largest metro-area employers of protective service workers, all other in Virginia.
| Metro Area | Number Employed | Annual Median Salary |
|---|---|---|
| Virginia Beach-Chesapeake-Norfolk, VA-NC | 740 | $31,500 |
| Roanoke, VA | 160 | $30,090 |
| Lynchburg, VA | 130 | $33,750 |
| Blacksburg-Christiansburg-Radford, VA | 110 | $30,260 |
Top States for Protective Service Workers, All Other Employment
These states have the highest employment of protective service workers, all other work.
| State | Number Employed |
|---|---|
| California | 23,390 |
| Texas | 5,970 |
| Virginia | 5,170 |
| Colorado | 5,020 |
| Pennsylvania | 4,670 |
| Washington | 4,560 |
| Florida | 3,790 |
| New Jersey | 3,410 |
| Ohio | 2,840 |
| Oregon | 2,480 |
| Louisiana | 2,020 |
| New York | 1,660 |
| Arizona | 1,430 |
| Maryland | 1,270 |
| Nevada | 1,120 |
| Georgia | 1,030 |
| Michigan | 990 |
| Wisconsin | 840 |
| Tennessee | 820 |
| Connecticut | 770 |
Highest-Paying States for Protective Service Workers, All Other
Where protective service workers, all other earn the most: protective service workers, all other.
| State | Annual Median Salary |
|---|---|
| District of Columbia | $84,360 |
| New Hampshire | $83,510 |
| New Mexico | $66,640 |
| Rhode Island | $64,140 |
| Hawaii | $60,900 |
| New York | $59,830 |
| Maryland | $55,870 |
| Wisconsin | $55,660 |
| Nevada | $55,440 |
| Alaska | $55,370 |
Also Known As
Bus Escort, Bus Matron, Bus Monitor, Cafeteria Monitor, Community Service Patrol Officer, Deputy United States Marshal, Federal Agent, Gamewell Operator, Hall Monitor, Park Ranger, Playground Monitor, Polygraph Examiner, Ranger, School Bus Monitor, Shopper.
References
- U.S. Bureau of Labor Statistics, Occupational Employment and Wage Statistics — https://www.bls.gov/oes/
- O*NET Online — https://www.onetonline.org/
- BLS Employment Projections — https://www.bls.gov/emp/
- O*NET-SOC code: 33-9099.00
Course Advisor provides higher-education, college and university, degree, program, career, salary, and other helpful information to students, faculty, institutions, and other internet audiences. Presented information and data are subject to change. Inclusion on this website does not imply or represent a direct relationship with the company, school, or brand. Information, though believed correct at time of publication, may not be correct, and no warranty is provided. Contact the schools to verify any information before relying on it. Financial aid may be available for those who qualify. The displayed options may include sponsored or recommended results, not necessarily based on your preferences.
© Course Advisor – All Rights Reserved.