Historians in Pennsylvania
Want to work as a Historians in Pennsylvania? Below are the key facts. Research, analyze, record, and interpret the past as recorded in sources, such as government and institutional records, newspapers and other periodicals, photographs, interviews, films, electronic media, and unpublished manuscripts, such as personal diaries and letters.
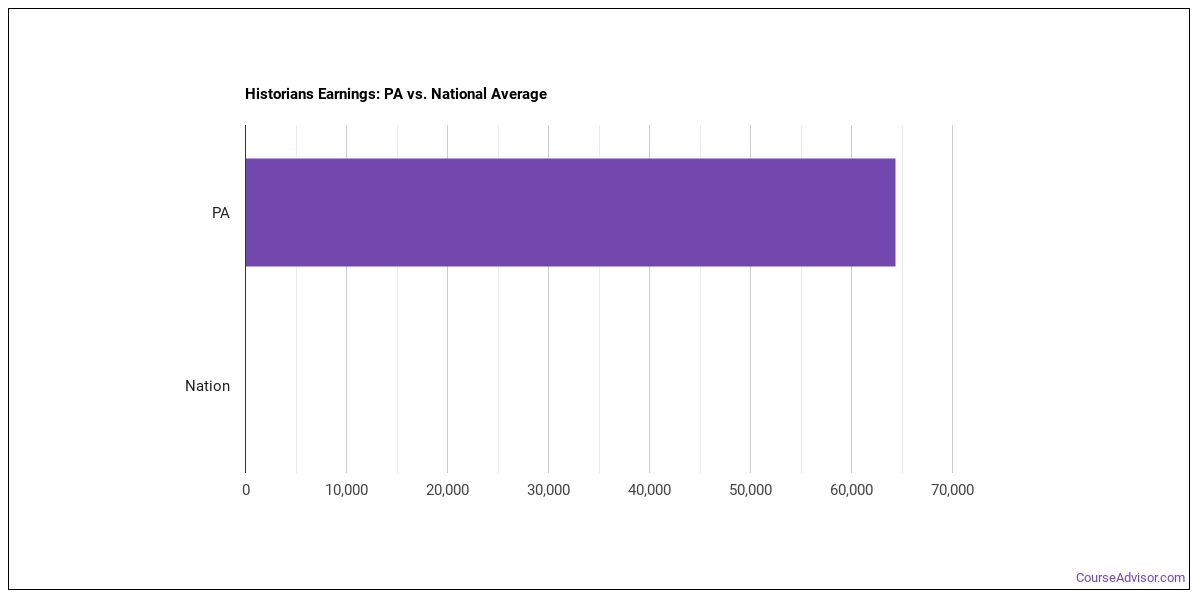
What do Historians Make in Pennsylvania?
For historians working in Pennsylvania, wages run about $72,720 per year (or about $34.96/hour).Pay can range from $58,950 at the 10th percentile to $99,920 at the 90th percentile.
| Wage Statistic | Annual | Hourly |
|---|---|---|
| 10th percentile | $58,950 | $28.34 |
| 25th percentile | $62,900 | $30.24 |
| Median (50th) | $72,720 | $34.96 |
| 75th percentile | $85,680 | $41.19 |
| 90th percentile | $99,920 | $48.04 |

The location quotient — a measure of how concentrated this occupation is in Pennsylvania nationwide is 0.53, indicating fewer historians per worker than the national average.
National Wage Comparison
Nationally, historians earn a median of $89,780 per year ($43.16/hour), below the Pennsylvania median.
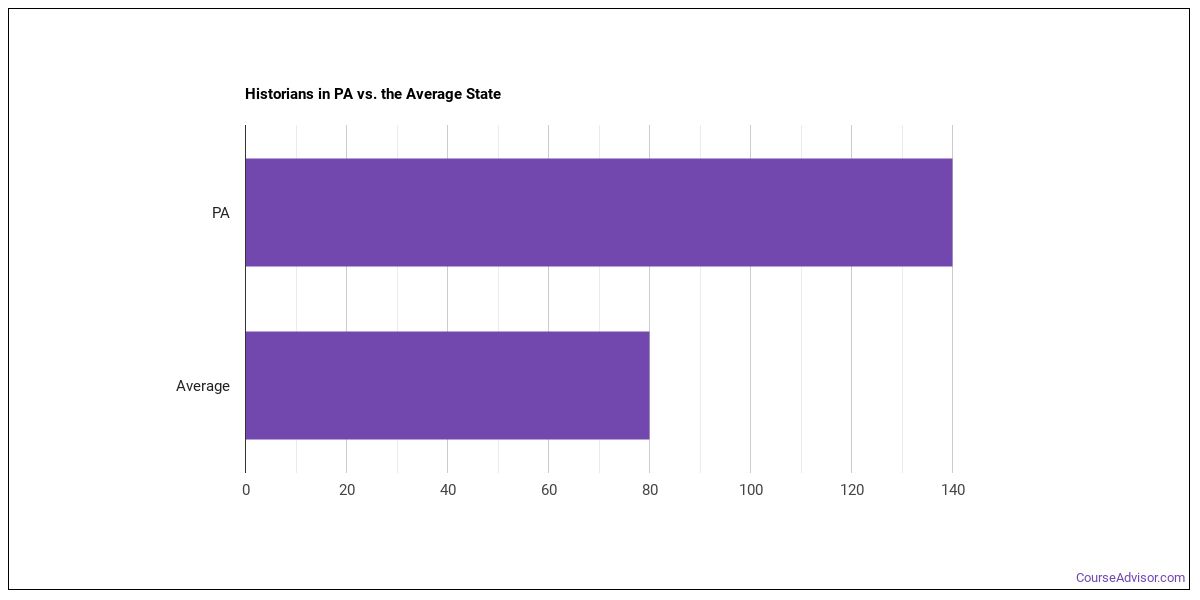
Employment Outlook
National employment for 67,367 historians in the U.S.. In Pennsylvania alone, around 70 people work in this role. That puts the state above the typical state, which employs around 60 historians.

Top Pennsylvania Metros for Historians
The largest metro-area employers of historians in Pennsylvania.
| Metro Area | Number Employed | Annual Median Salary |
|---|---|---|
| Philadelphia-Camden-Wilmington, PA-NJ-DE-MD | 30 | $85,160 |
Top States for Historians Employment
View the states that employ the most historians work.
| State | Number Employed |
|---|---|
| New York | 420 |
| District of Columbia | 260 |
| California | 180 |
| Virginia | 180 |
| New Jersey | 90 |
| Utah | 90 |
| Mississippi | 90 |
| Florida | 80 |
| Michigan | 70 |
| Pennsylvania | 70 |
| Georgia | 70 |
| Texas | 70 |
| Hawaii | 60 |
| Oregon | 60 |
| Washington | 60 |
| Maryland | 60 |
| Alabama | 60 |
| South Carolina | 60 |
| Indiana | 50 |
| Connecticut | 50 |
Highest-Paying States for Historians
Where historians earn the most: historians.
| State | Annual Median Salary |
|---|---|
| District of Columbia | $117,960 |
| North Carolina | $101,440 |
| Maryland | $99,300 |
| Washington | $94,760 |
| Virginia | $94,060 |
| Illinois | $92,020 |
| Connecticut | $88,890 |
| Florida | $84,590 |
| Texas | $84,160 |
| Minnesota | $84,160 |
Skills
Key historians skills, rated on an importance scale of 0 to 5:
Knowledge Areas
Key knowledge areas for this occupation, rated on an importance scale of 0 to 5:
Abilities
Key abilities for historians, rated on an importance scale of 0 to 5:
Daily Tasks
Historians typically:
- Gather historical data from sources such as archives, court records, diaries, news files, and photographs, as well as from books, pamphlets, and periodicals.
- Organize data, and analyze and interpret its authenticity and relative significance.
- Prepare publications and exhibits, or review those prepared by others, to ensure their historical accuracy.
- Organize information for publication and for other means of dissemination, such as via storage media or the Internet.
- Conduct historical research as a basis for the identification, conservation, and reconstruction of historic places and materials.
- Conserve and preserve manuscripts, records, and other artifacts.
- Present historical accounts in terms of individuals or social, ethnic, political, economic, or geographic groupings.
- Research the history of a particular country or region, or of a specific time period.
- Conduct historical research, and publish or present findings and theories.
- Determine which topics to research, or pursue research topics specified by clients or employers.
- Recommend actions related to historical art, such as which items to add to a collection or which items to display in an exhibit.
- Research and prepare manuscripts in support of public programming and the development of exhibits at historic sites, museums, libraries, and archives.
Work Activities
- Getting Information
- Identifying Objects, Actions, and Events
- Working with Computers
- Processing Information
- Communicating with People Outside the Organization
- Documenting/Recording Information
- Interpreting the Meaning of Information for Others
- Establishing and Maintaining Interpersonal Relationships
- Communicating with Supervisors, Peers, or Subordinates
- Judging the Qualities of Objects, Services, or People
- Making Decisions and Solving Problems
- Analyzing Data or Information
Tools & Technology
Technologies frequently used: Hot technologies: Adobe Acrobat, Adobe InDesign In-demand technologies: ESRI ArcGIS software
What Major Will Prepare You For This Career?
Several college majors map to this occupation:
- History
- Historic Preservation
- History and Language/Literature
- Classical & Ancient Studies
- Medieval Studies
- Maritime Studies
- History and Political Science
- Holocaust Studies
- Bioethics/Medical Ethics
- Architectural History
Featured schools near , edit
Related Careers
Related occupations to historians include:
- Sociologists
- Anthropologists and Archeologists
- Geographers
- Social Science Research Assistants
- Architecture Teachers, Postsecondary
- Anthropology and Archeology Teachers, Postsecondary
Also Known As
Architectural Historian, Art Historian, Collections Specialist, County Historian, Dance Historian, Dramatic Arts Historian, Field Court Researcher, Film Historian, Genealogist, Genealogist Researcher, Health Historian, Historian, Historian Developer, Historic Architectural Resources Curator, Historic Interpreter.
References
- U.S. Bureau of Labor Statistics, Occupational Employment and Wage Statistics — https://www.bls.gov/oes/
- O*NET Online — https://www.onetonline.org/
- BLS Employment Projections — https://www.bls.gov/emp/
- O*NET-SOC code: 19-3093.00
Course Advisor provides higher-education, college and university, degree, program, career, salary, and other helpful information to students, faculty, institutions, and other internet audiences. Presented information and data are subject to change. Inclusion on this website does not imply or represent a direct relationship with the company, school, or brand. Information, though believed correct at time of publication, may not be correct, and no warranty is provided. Contact the schools to verify any information before relying on it. Financial aid may be available for those who qualify. The displayed options may include sponsored or recommended results, not necessarily based on your preferences.
© Course Advisor – All Rights Reserved.