Engineering Technologists and Technicians, Except Drafters, All Other in Connecticut
Considering working as an Engineering Technologists and Technicians, Except Drafters, All Other in Connecticut? Here’s what the data says. All engineering technologists and technicians, except drafters, not listed separately.
What do Engineering Technologists and Technicians, Except Drafters, All Other Make in Connecticut?
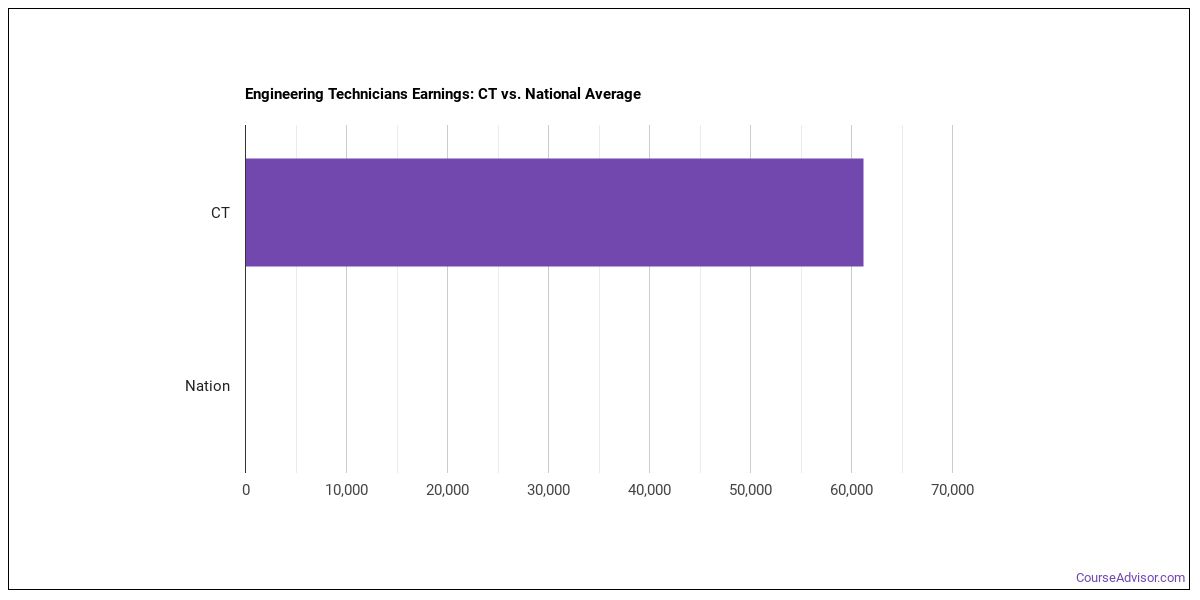
The engineering technologists and technicians, except drafters, all other working in Connecticut, the median annual wage is $82,700 per year (or roughly $39.76/hour).Pay can range from $53,970 at the 10th percentile to $121,550 at the 90th percentile.
| Wage Statistic | Annual | Hourly |
|---|---|---|
| 10th percentile | $53,970 | $25.95 |
| 25th percentile | $61,480 | $29.56 |
| Median (50th) | $82,700 | $39.76 |
| 75th percentile | $102,100 | $49.09 |
| 90th percentile | $121,550 | $58.44 |

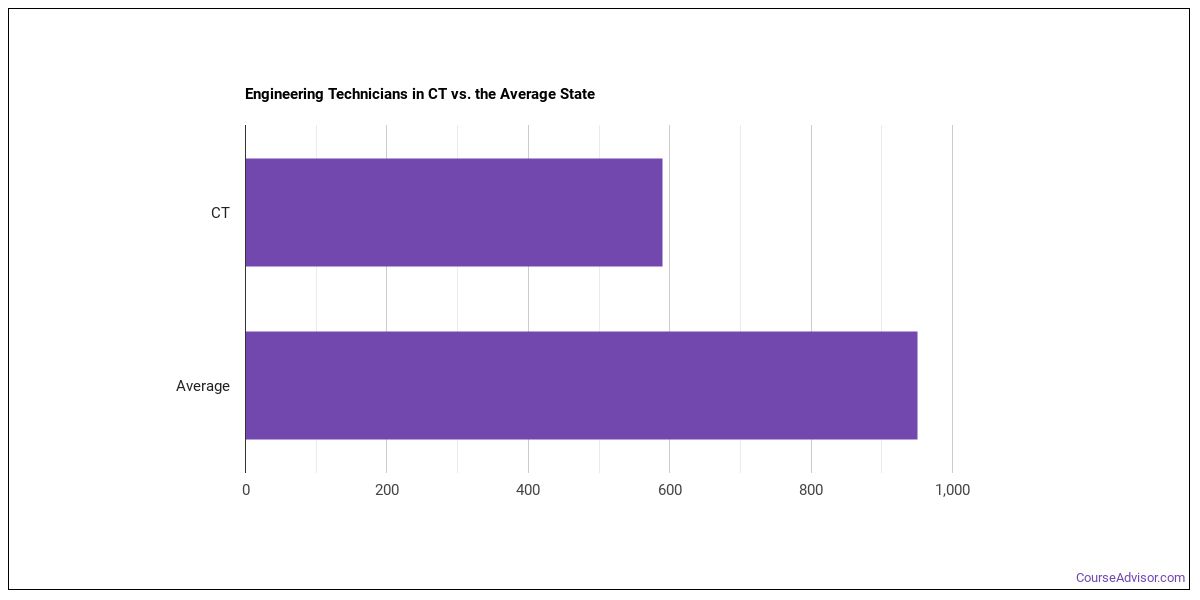
The location quotient — a measure of how concentrated this occupation is in Connecticut compared to the national average — is 0.90.
National Wage Comparison
Nationally, engineering technologists and technicians, except drafters, all other earn a median of $121,642 per year ($58.48/hour), lower than the Connecticut median.
Employment Outlook
National employment for 166,341 engineering technologists and technicians, except drafters, all other across the United States. In Connecticut alone, about 630 people work in this role. That’s fewer than the typical state, which employs around 680 engineering technologists and technicians, except drafters, all other.

Top Connecticut Metros for Engineering Technologists and Technicians, Except Drafters, All Other
The largest metro-area employers of engineering technologists and technicians, except drafters, all other in Connecticut.
| Metro Area | Number Employed | Annual Median Salary |
|---|---|---|
| Hartford-West Hartford-East Hartford, CT | 260 | $82,050 |
| Bridgeport-Stamford-Danbury, CT | 110 | $81,190 |
| New Haven, CT | 60 | $61,310 |
| Waterbury-Shelton, CT | 50 | $80,460 |
Top States for Engineering Technologists and Technicians, Except Drafters, All Other Employment
The table below shows the states where the most engineering technologists and technicians, except drafters, all other work.
| State | Number Employed |
|---|---|
| Texas | 8,570 |
| California | 7,840 |
| Virginia | 3,810 |
| Maryland | 2,680 |
| Florida | 2,440 |
| Washington | 2,310 |
| New York | 2,200 |
| Georgia | 2,140 |
| Pennsylvania | 2,120 |
| Louisiana | 2,020 |
| Ohio | 1,460 |
| North Carolina | 1,400 |
| Colorado | 1,320 |
| Michigan | 1,290 |
| Illinois | 1,160 |
| Oregon | 1,110 |
| Utah | 1,090 |
| Massachusetts | 1,080 |
| New Jersey | 1,060 |
| Kansas | 970 |
Highest-Paying States for Engineering Technologists and Technicians, Except Drafters, All Other
These states pay the most for engineering technologists and technicians, except drafters, all other.
| State | Annual Median Salary |
|---|---|
| District of Columbia | $109,120 |
| New Mexico | $107,310 |
| Maryland | $104,830 |
| Maine | $101,500 |
| Rhode Island | $98,340 |
| Washington | $96,120 |
| Virginia | $95,640 |
| Hawaii | $90,380 |
| Nevada | $88,860 |
| California | $83,350 |
What Major Will Prepare You For This Career?
Related college programs include:
- Environmental Control Technology
- Computer Engineering
- Architectural Engineering
- Electromechanical Engineering
- Energy Systems Technologies/Technicians
- Industrial Production Technology
- Engineering-Related Fields
- Electronics Engineering
- Nuclear Engineering
- General Engineering Technology
- Engineering-Related Technologies
- Mechanical Engineering
- Mining & Petroleum Technology
- Military Applied Sciences
- Military Systems & Maintenance
Featured schools near , edit
Also Known As
Agricultural Engineering Technician, Agricultural Engineering Technicians, Agricultural Engineering Technologist, Air Analyst, Air Tester, Biomedical Engineering Aide, Biomedical Engineering Technician, Biomedical Engineering Technologist, Blueprint Engineer, Chemical Engineering Technician, Chemical Engineering Technologist, Drawing Checker, Drawing Tracer, Echometer Engineer, Engineering Aide.
References
- U.S. Bureau of Labor Statistics, Occupational Employment and Wage Statistics — https://www.bls.gov/oes/
- O*NET Online — https://www.onetonline.org/
- BLS Employment Projections — https://www.bls.gov/emp/
- O*NET-SOC code: 17-3029.00
Course Advisor provides higher-education, college and university, degree, program, career, salary, and other helpful information to students, faculty, institutions, and other internet audiences. Presented information and data are subject to change. Inclusion on this website does not imply or represent a direct relationship with the company, school, or brand. Information, though believed correct at time of publication, may not be correct, and no warranty is provided. Contact the schools to verify any information before relying on it. Financial aid may be available for those who qualify. The displayed options may include sponsored or recommended results, not necessarily based on your preferences.
© Course Advisor – All Rights Reserved.