Visual & Performing Arts Schools in Texas
In 2022-2023, 8,417 students earned their Visual & Performing Arts degrees in TX.
A Visual & Performing Arts major is the 13th most popular major in this state.
Education Levels of Visual & Performing Arts Majors in Texas
Visual & Performing Arts majors in the state tend to have the following degree levels:
| Education Level | Number of Grads |
|---|---|
| Bachelor’s Degree | 5,040 |
| Associate Degree | 1,445 |
| Master’s Degree | 834 |
| Award Taking Less Than 1 Year | 530 |
| Award Taking 1 to 2 Years | 363 |
| Award Taking 2 to 4 Years | 363 |
| Doctor’s Degree (Research / Scholarship) | 158 |
| Doctor’s Degree (Professional Practice) | 158 |
| Doctor’s Degree (Other) | 158 |
| Post-Master’s Certificate | 47 |
| Postbaccalaureate Certificate | 47 |
Gender Distribution
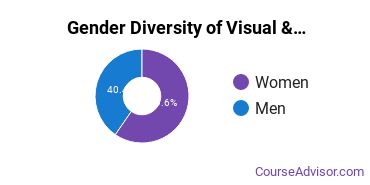
In Texas, a visual & performing arts major is more popular with women than with men.

Racial Distribution
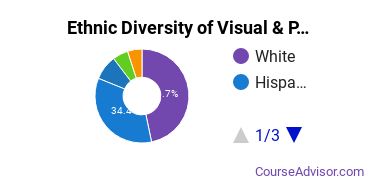
The racial distribution of visual & performing arts majors in Texas is as follows:
- Asian: 5.7%
- Black or African American: 8.1%
- Hispanic or Latino: 33.4%
- White: 43.0%
- Non-Resident Alien: 4.7%
- Other Races: 5.1%

Jobs for Visual & Performing Arts Grads in Texas
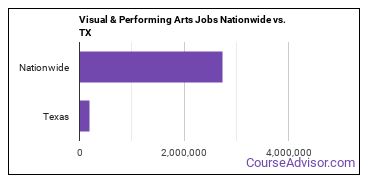
In this state, there are 194,600 people employed in jobs related to a visual & performing arts degree, compared to 2,744,770 nationwide.

Wages for Visual & Performing Arts Jobs in Texas
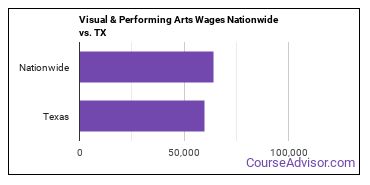
A typical salary for a visual & performing arts grad in the state is $59,810, compared to a typical salary of $64,340 nationwide.

Most Popular Visual & Performing Arts Programs in TX
There are 10 colleges in Texas that offer visual & performing arts degrees. Learn about the most popular 10 below:
This public school has an average net price of $15,205. The average student takes 4.46 years to complete their degree at UNT. Seeking financial aid? At this school, 95% of students receive it.
Request InformationOf all the teachers who work at the school, 83% are considered full time. Seeking financial aid? At this school, 89% of students receive it. The student to faculty ratio is 18 to 1.
Request InformationStudents enjoy a student to faculty ratio of 21 to 1. Most students complete their degree in 4.56 years. 83% of students are awarded financial aid at this school.
Request InformationThe full-time teacher rate is 78%. Students enjoy a student to faculty ratio of 21 to 1. 83% of students are awarded financial aid at this school.
Request InformationOf all the teachers who work at the school, 75% are considered full time. The student to faculty ratio is 27 to 1. Of all the students who attend this school, 75% get financial aid.
Request InformationMost students complete their degree in 4.49 years. Students enjoy a student to faculty ratio of 21 to 1. Seeking financial aid? At this school, 88% of students receive it.
Request InformationStudents who attend this public school pay an average net price of $14,244. 93% of students are awarded financial aid at this school. Most students complete their degree in 4.62 years.
Request InformationA typical student attending Austin Community College District will pay a net price of $6,581. Of all the students who attend this school, 65% get financial aid. Of all the teachers who work at the school, 40% are considered full time.
Request InformationOf all the teachers who work at the school, 71% are considered full time. It takes the average student 4.44 years to graduate. 17 to 1 is the student to faculty ratio.
Request InformationThe average student takes 4.70 years to complete their degree at UT Rio Grande Valley. Students enjoy a student to faculty ratio of 19 to 1. Of all the students who attend this school, 98% get financial aid.
Request InformationVisual & Performing Arts Careers in TX
Some of the careers visual & performing arts majors go into include:
| Job Title | TX Job Growth | TX Median Salary |
|---|---|---|
| Producers and Directors | 19% | $61,790 |
| Interior Designers | 16% | $51,630 |
| Artists | 10% | $41,500 |
Explore Major by State
Alabama
Arkansas
Connecticut
Florida
Idaho
Iowa
Louisiana
Massachusetts
Mississippi
Nebraska
New Jersey
North Carolina
Oklahoma
Rhode Island
Tennessee
Vermont
West Virginia
View Nationwide Visual & Performing Arts Report
References
- College Factual
- National Center for Education Statistics
- O*NET Online
- Image Credit: By Bonnielou2013 under License
More about our data sources and methodologies.


