Social Sciences Undergraduate Certificates
There are 1,552 schools in the United States where you can earn aundergraduate certificate in Social Sciences. Among those who recently graduated from the schools offering this degree, the majority were women, and30% were students from underrepresented racial-ethnic groups. Also, 8.1% of Social Sciences graduates were international students.
Featured schools near , edit
Education Levels of Social Sciences Majors
During the most recent year for which data is available, 185,019 people earned theirSocial Sciences majors across all award levels. The following table shows the number of diplomas awarded in Social Sciences at each degree level.
| Education Level | Number of Grads |
|---|---|
| Certificate (this page) | 246 |
| Associate’s Degree | 22,814 |
| Bachelor’s Degree | 134,637 |
| Master’s Degree | 23,444 |
| Doctor’s Degree | 3,734 |

Earnings of Social Sciences Majors With Undergraduate Certificates (All Award Levels)
The U.S. Department of Education reports a median salary for graduates with aundergraduate certificate in Social Sciences of $55,597 four years after graduation. These figures are reported program-wide, across all award levels.
This number may vary for many reasons. For instance, you may move to a location where people with your degree are rare and make more money.
| Years After Graduation | Median Earnings |
|---|---|
| 1 year | $42,225 |
| 4 years | $55,597 |
| 5 years | $64,933 |
Source: U.S. Department of Education College Scorecard, field-of-study earnings tracker (program-wide, all award levels).
Student Debt (All Award Levels)
The data on debt ranges for Social Sciences majors who have their undergraduate certificate is not currently available.
Student Diversity
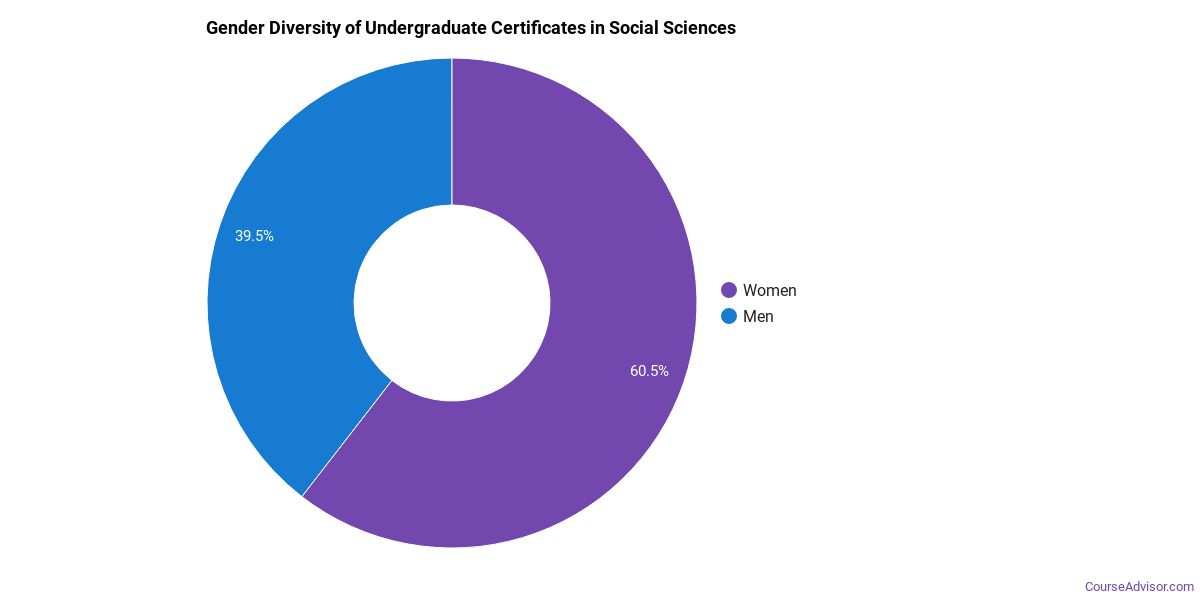
This degree is more popular with female students. About 58.5% of graduates with this degree are women.
| Gender | Number of Grads |
|---|---|
| Men | 102 |
| Women | 144 |
The racial-ethnic distribution of Social Sciences graduates is as follows:
| Race / Ethnicity | Number of Grads | Share |
|---|---|---|
| White | 153 | 62.2% |
| Asian | 8 | 3.3% |
| Hispanic or Latino | 28 | 11.4% |
| Black or African American | 18 | 7.3% |
| American Indian / Alaska Native | 1 | 0.4% |
| Native Hawaiian / Pacific Islander | 1 | 0.4% |
| Two or More Races | 8 | 3.3% |
| Race Unknown | 9 | 3.7% |
| International Students | 20 | 8.1% |
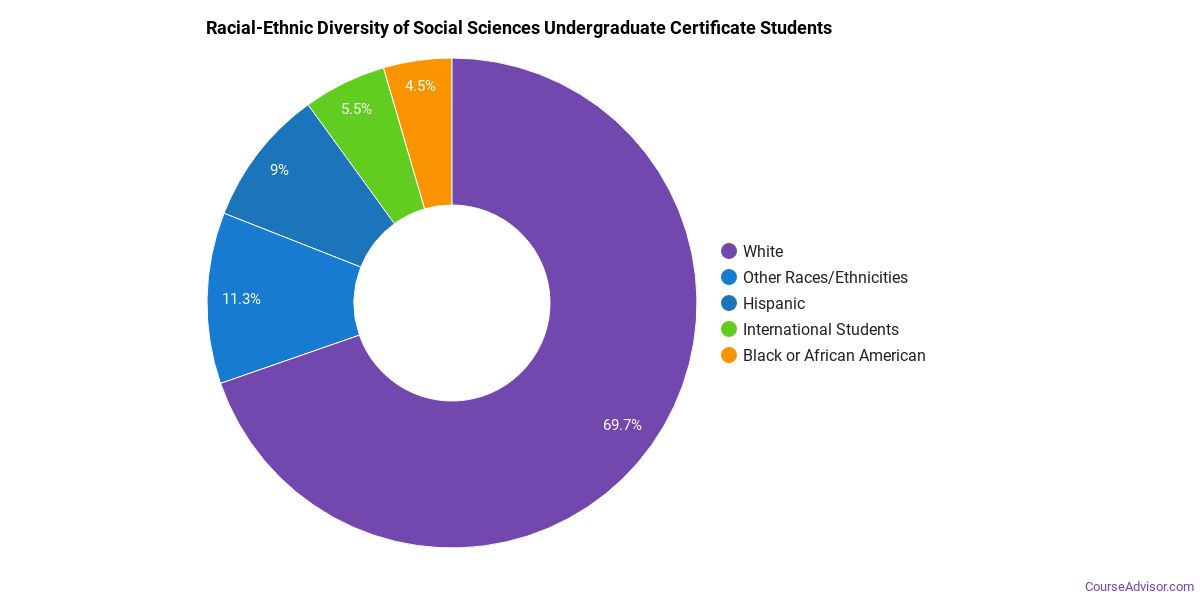
This degree is moderately popular with international students. Around 8.1% of graduates are in this category.
See the minority definition in the References below.
Most Popular Social Sciences Programs for Undergraduate Certificates
There are 1,707 colleges that offer a undergraduate certificate in Social Sciences. Learn more about the most popular below:

The most popular school in the United States for Social Sciences students seeking a undergraduate certificate is University of California-Los Angeles. During the most recent year for which we have data, 2,753 people received their undergraduate certificate in Social Sciences from this school. Graduates who complete their undergraduate certificate in Social Sciences here go on to a median salary of $40,669.
University of Chicago comes in at #2 on our list of the most popular colleges offering undergraduate certificates in Social Sciences. This school awarded 2,074 undergraduate certificates in Social Sciences in the most recent reporting year. Data shows that graduates who hold this degree go on to make a median salary of $40,669.
University of California-Santa Barbara comes in at #3 on our list of the most popular colleges offering undergraduate certificates in Social Sciences. This school awarded 1,927 undergraduate certificates in Social Sciences in the most recent reporting year. Graduates who complete their undergraduate certificate in Social Sciences here go on to a median salary of $40,669.
Johns Hopkins University comes in at #4 on our list of the most popular colleges offering undergraduate certificates in Social Sciences. This school awarded 1,818 undergraduate certificates in Social Sciences in the most recent reporting year. Data shows that graduates who hold this degree go on to make a median salary of $40,669.
University of California-Berkeley comes in at #5 on our list of the most popular colleges offering undergraduate certificates in Social Sciences. This school awarded 1,725 undergraduate certificates in Social Sciences in the most recent reporting year. Graduates who complete their undergraduate certificate in Social Sciences here go on to a median salary of $40,669.
University of Wisconsin-Madison is a popular choice for Social Sciences majors seeking their undergraduate certificate. During the most recent year for which we have data, 1,706 people received their undergraduate certificate in Social Sciences from this school. Data shows that graduates who hold this degree go on to make a median salary of $40,669.
New York University comes in at #7 on our list of the most popular colleges offering undergraduate certificates in Social Sciences. During the most recent year for which we have data, 1,658 people received their undergraduate certificate in Social Sciences from this school. Data shows that graduates who hold this degree go on to make a median salary of $40,669.
University of California-Irvine comes in at #8 on our list of the most popular colleges offering undergraduate certificates in Social Sciences. During the most recent year for which we have data, 1,628 people received their undergraduate certificate in Social Sciences from this school. Data shows that graduates who hold this degree go on to make a median salary of $40,669.
Florida State University comes in at #9 on our list of the most popular colleges offering undergraduate certificates in Social Sciences. This school awarded 1,577 undergraduate certificates in Social Sciences in the most recent reporting year. Data shows that graduates who hold this degree go on to make a median salary of $40,669.
Columbia University in the City of New York comes in at #10 on our list of the most popular colleges offering undergraduate certificates in Social Sciences. This school awarded 1,557 undergraduate certificates in Social Sciences in the most recent reporting year. Graduates who complete their undergraduate certificate in Social Sciences here go on to a median salary of $40,669.
Georgetown University is a popular choice for Social Sciences majors seeking their undergraduate certificate. During the most recent year for which we have data, 1,554 people received their undergraduate certificate in Social Sciences from this school. Data shows that graduates who hold this degree go on to make a median salary of $40,669.
George Washington University is a popular choice for Social Sciences majors seeking their undergraduate certificate. During the most recent year for which we have data, 1,388 people received their undergraduate certificate in Social Sciences from this school. Graduates who complete their undergraduate certificate in Social Sciences here go on to a median salary of $40,669.
University of Michigan-Ann Arbor is a popular choice for Social Sciences majors seeking their undergraduate certificate. During the most recent year for which we have data, 1,364 people received their undergraduate certificate in Social Sciences from this school. Data shows that graduates who hold this degree go on to make a median salary of $40,669.
University of Florida is a popular choice for Social Sciences majors seeking their undergraduate certificate. During the most recent year for which we have data, 1,307 people received their undergraduate certificate in Social Sciences from this school. Data shows that graduates who hold this degree go on to make a median salary of $40,669.
University of Maryland-College Park is a popular choice for Social Sciences majors seeking their undergraduate certificate. This school awarded 1,295 undergraduate certificates in Social Sciences in the most recent reporting year. Graduates who complete their undergraduate certificate in Social Sciences here go on to a median salary of $40,669.
University of South Florida is a popular choice for Social Sciences majors seeking their undergraduate certificate. This school awarded 1,295 undergraduate certificates in Social Sciences in the most recent reporting year. Data shows that graduates who hold this degree go on to make a median salary of $40,669.
University of California-Davis is a popular choice for Social Sciences majors seeking their undergraduate certificate. During the most recent year for which we have data, 1,264 people received their undergraduate certificate in Social Sciences from this school. Data shows that graduates who hold this degree go on to make a median salary of $40,669.
Harvard University is a popular choice for Social Sciences majors seeking their undergraduate certificate. During the most recent year for which we have data, 1,240 people received their undergraduate certificate in Social Sciences from this school. Data shows that graduates who hold this degree go on to make a median salary of $40,669.
American University is a popular choice for Social Sciences majors seeking their undergraduate certificate. During the most recent year for which we have data, 1,238 people received their undergraduate certificate in Social Sciences from this school. Graduates who complete their undergraduate certificate in Social Sciences here go on to a median salary of $40,669.
University of North Carolina at Chapel Hill is a popular choice for Social Sciences majors seeking their undergraduate certificate. This school awarded 1,211 undergraduate certificates in Social Sciences in the most recent reporting year. Data shows that graduates who hold this degree go on to make a median salary of $40,669.
Social Sciences Majors to Study
| Major | Annual Degrees Awarded |
|---|---|
| Economics | 45,628 |
| Political Science and Government | 44,942 |
| Sociology | 31,380 |
| Social Sciences, General | 17,510 |
| International Relations and National Security Studies | 13,035 |
Explore Social Sciences by State
Alabama
California
District of Columbia
Idaho
Kansas
Maryland
Mississippi
Nevada
New York
Oklahoma
South Carolina
Utah
West Virginia
Alaska
Colorado
Florida
Illinois
Kentucky
Massachusetts
Missouri
New Hampshire
North Carolina
Oregon
South Dakota
Vermont
Wisconsin
References
The racial-ethnic minority student count is calculated by taking the total number of students and subtracting white students, international students, and students whose race/ethnicity was unknown. This number is then divided by the total number of students to obtain the percentage of racial-ethnic minorities.
- College Factual
- National Center for Education Statistics (IPEDS)
- O*NET Online
- U.S. Bureau of Labor Statistics
- U.S. Department of Education College Scorecard
More about our data sources and methodologies.
Course Advisor provides higher-education, college and university, degree, program, career, salary, and other helpful information to students, faculty, institutions, and other internet audiences. Presented information and data are subject to change. Inclusion on this website does not imply or represent a direct relationship with the company, school, or brand. Information, though believed correct at time of publication, may not be correct, and no warranty is provided. Contact the schools to verify any information before relying on it. Financial aid may be available for those who qualify. The displayed options may include sponsored or recommended results, not necessarily based on your preferences.
© Course Advisor – All Rights Reserved.