Philosophy & Religious Studies Undergraduate Certificates
There are 1,078 schools in the United States where you can earn aundergraduate certificate in Philosophy & Religious Studies. In recent years, the majority of students earning degrees in this area were women, and about35% were students from underrepresented racial-ethnic groups. Also, 9.3% of Philosophy & Religious Studies graduates were international students.
Featured schools near , edit
Education Levels of Philosophy & Religious Studies Majors
In the most recent reporting year, 18,629 students earned theirPhilosophy & Religious Studies majors across all award levels. The following table shows the number of diplomas awarded in Philosophy & Religious Studies at each degree level.
| Education Level | Number of Grads |
|---|---|
| Certificate (this page) | 43 |
| Associate’s Degree | 1,781 |
| Bachelor’s Degree | 12,893 |
| Master’s Degree | 3,216 |
| Doctor’s Degree | 695 |
Earnings of Philosophy & Religious Studies Majors With Undergraduate Certificates (All Award Levels)
Federal data tracks the median salary for graduates with aundergraduate certificate in Philosophy & Religious Studies of $39,740 four years after graduation. These figures are reported program-wide, across all award levels.
A lot of factors can contribute to this number, such as the location of your workplace and the availability of other perks and bonuses.
| Years After Graduation | Median Earnings |
|---|---|
| 1 year | $32,072 |
| 4 years | $39,740 |
| 5 years | $47,196 |
Source: U.S. Department of Education College Scorecard, field-of-study earnings tracker (program-wide, all award levels).
Student Debt (All Award Levels)
We do not have the data to estimate the median debt for graduates with this degree.
Student Diversity
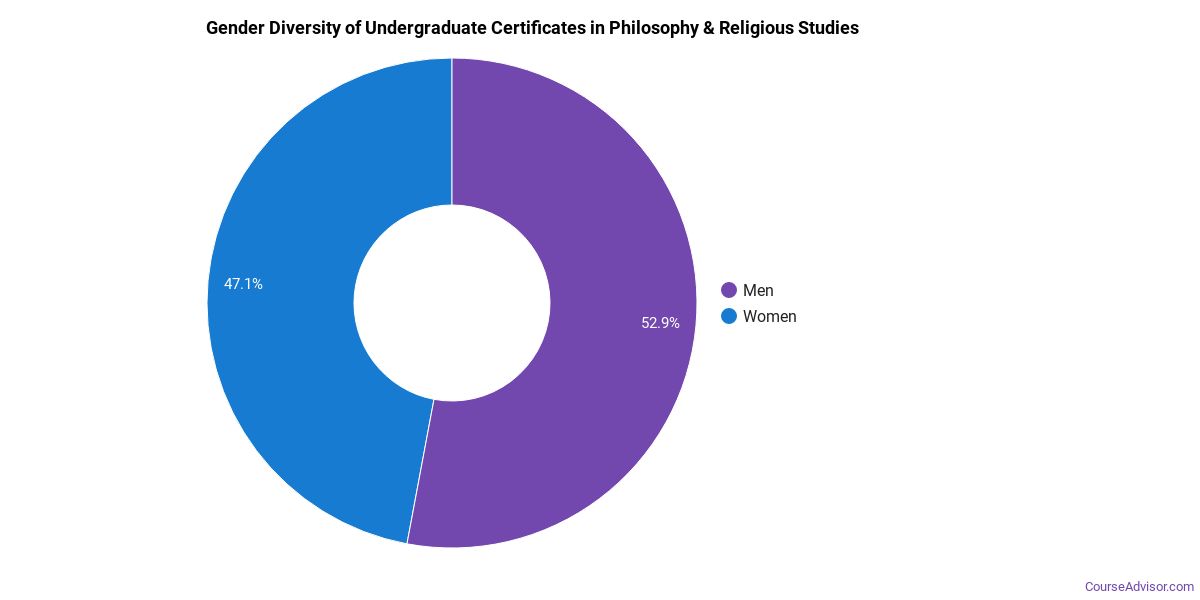
This degree is more popular with female students. About 53.5% of graduates with this degree are women.
| Gender | Number of Grads |
|---|---|
| Men | 20 |
| Women | 23 |
The racial-ethnic distribution of Philosophy & Religious Studies graduates is as follows:
| Race / Ethnicity | Number of Grads | Share |
|---|---|---|
| White | 24 | 55.8% |
| Asian | 2 | 4.7% |
| Hispanic or Latino | 6 | 14.0% |
| Black or African American | 6 | 14.0% |
| Race Unknown | 1 | 2.3% |
| International Students | 4 | 9.3% |
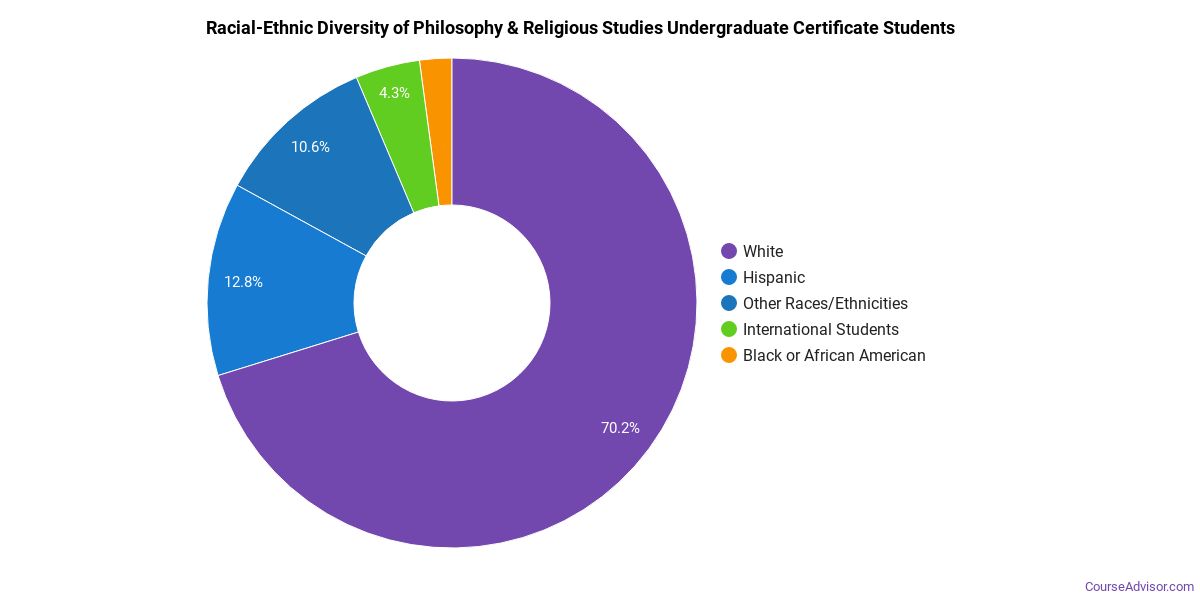
This degree is moderately popular with international students. Around 9.3% of graduates are in this category.
See the minority definition in the References below.
Most Popular Philosophy & Religious Studies Programs for Undergraduate Certificates
There are 1,273 colleges that offer a undergraduate certificate in Philosophy & Religious Studies. Learn more about the most popular below:

Beth Medrash Govoha tops the list of the most popular schools in the U.S. for Philosophy & Religious Studies majors seeking their undergraduate certificate. During the most recent year for which we have data, 1,600 people received their undergraduate certificate in Philosophy & Religious Studies from this school. Graduates who complete their undergraduate certificate in Philosophy & Religious Studies here go on to a median salary of $40,669.
Liberty University comes in at #2 on our list of the most popular colleges offering undergraduate certificates in Philosophy & Religious Studies. During the most recent year for which we have data, 632 people received their undergraduate certificate in Philosophy & Religious Studies from this school. Data shows that graduates who hold this degree go on to make a median salary of $40,669.
Yeshiva University comes in at #3 on our list of the most popular colleges offering undergraduate certificates in Philosophy & Religious Studies. This school awarded 539 undergraduate certificates in Philosophy & Religious Studies in the most recent reporting year. Data shows that graduates who hold this degree go on to make a median salary of $40,669.
Uta Mesivta of Kiryas Joel is a popular choice for Philosophy & Religious Studies majors seeking their undergraduate certificate. This school awarded 476 undergraduate certificates in Philosophy & Religious Studies in the most recent reporting year. Graduates who complete their undergraduate certificate in Philosophy & Religious Studies here go on to a median salary of $40,669.
United Talmudical Seminary is a popular choice for Philosophy & Religious Studies majors seeking their undergraduate certificate. During the most recent year for which we have data, 324 people received their undergraduate certificate in Philosophy & Religious Studies from this school. Graduates who complete their undergraduate certificate in Philosophy & Religious Studies here go on to a median salary of $40,669.
University of Pennsylvania is a popular choice for Philosophy & Religious Studies majors seeking their undergraduate certificate. This school awarded 209 undergraduate certificates in Philosophy & Religious Studies in the most recent reporting year. Data shows that graduates who hold this degree go on to make a median salary of $40,669.
Central Yeshiva Tomchei Tmimim Lubavitz comes in at #7 on our list of the most popular colleges offering undergraduate certificates in Philosophy & Religious Studies. During the most recent year for which we have data, 170 people received their undergraduate certificate in Philosophy & Religious Studies from this school. Graduates who complete their undergraduate certificate in Philosophy & Religious Studies here go on to a median salary of $40,669.
University of California-Santa Barbara comes in at #8 on our list of the most popular colleges offering undergraduate certificates in Philosophy & Religious Studies. During the most recent year for which we have data, 141 people received their undergraduate certificate in Philosophy & Religious Studies from this school. Graduates who complete their undergraduate certificate in Philosophy & Religious Studies here go on to a median salary of $40,669.
Mosdos Yaakov V'Yisroel is a popular choice for Philosophy & Religious Studies majors seeking their undergraduate certificate. During the most recent year for which we have data, 134 people received their undergraduate certificate in Philosophy & Religious Studies from this school.
Columbia University in the City of New York is a popular choice for Philosophy & Religious Studies majors seeking their undergraduate certificate. During the most recent year for which we have data, 127 people received their undergraduate certificate in Philosophy & Religious Studies from this school. Data shows that graduates who hold this degree go on to make a median salary of $40,669.
University of California-Los Angeles is a popular choice for Philosophy & Religious Studies majors seeking their undergraduate certificate. This school awarded 123 undergraduate certificates in Philosophy & Religious Studies in the most recent reporting year. Data shows that graduates who hold this degree go on to make a median salary of $40,669.
Seminary Bnos Chaim is a popular choice for Philosophy & Religious Studies majors seeking their undergraduate certificate. This school awarded 121 undergraduate certificates in Philosophy & Religious Studies in the most recent reporting year. Data shows that graduates who hold this degree go on to make a median salary of $40,669.
Boston College is a popular choice for Philosophy & Religious Studies majors seeking their undergraduate certificate. This school awarded 103 undergraduate certificates in Philosophy & Religious Studies in the most recent reporting year. Data shows that graduates who hold this degree go on to make a median salary of $40,669.
University of California-Berkeley comes in at #14 on our list of the most popular colleges offering undergraduate certificates in Philosophy & Religious Studies. This school awarded 100 undergraduate certificates in Philosophy & Religious Studies in the most recent reporting year. Data shows that graduates who hold this degree go on to make a median salary of $40,669.
University of Southern California comes in at #15 on our list of the most popular colleges offering undergraduate certificates in Philosophy & Religious Studies. This school awarded 99 undergraduate certificates in Philosophy & Religious Studies in the most recent reporting year. Graduates who complete their undergraduate certificate in Philosophy & Religious Studies here go on to a median salary of $40,669.
University of Washington-Seattle Campus comes in at #16 on our list of the most popular colleges offering undergraduate certificates in Philosophy & Religious Studies. This school awarded 99 undergraduate certificates in Philosophy & Religious Studies in the most recent reporting year. Data shows that graduates who hold this degree go on to make a median salary of $40,669.
Yeshivath Viznitz is a popular choice for Philosophy & Religious Studies majors seeking their undergraduate certificate. During the most recent year for which we have data, 99 people received their undergraduate certificate in Philosophy & Religious Studies from this school. Graduates who complete their undergraduate certificate in Philosophy & Religious Studies here go on to a median salary of $40,669.
Harvard University comes in at #18 on our list of the most popular colleges offering undergraduate certificates in Philosophy & Religious Studies. This school awarded 98 undergraduate certificates in Philosophy & Religious Studies in the most recent reporting year. Data shows that graduates who hold this degree go on to make a median salary of $40,669.
New York University is a popular choice for Philosophy & Religious Studies majors seeking their undergraduate certificate. This school awarded 94 undergraduate certificates in Philosophy & Religious Studies in the most recent reporting year. Graduates who complete their undergraduate certificate in Philosophy & Religious Studies here go on to a median salary of $40,669.
Yeshiva of Machzikai Hadas is a popular choice for Philosophy & Religious Studies majors seeking their undergraduate certificate. This school awarded 93 undergraduate certificates in Philosophy & Religious Studies in the most recent reporting year. Data shows that graduates who hold this degree go on to make a median salary of $40,669.
Philosophy & Religious Studies Concentrations
| Major | Annual Degrees Awarded |
|---|---|
| Religion/Religious Studies | 9,248 |
| Philosophy | 8,973 |
| Philosophy and Religious Studies, Other | 224 |
| PHILOSOPHY AND RELIGIOUS STUDIES | 184 |
Explore Philosophy & Religious Studies by State
Alabama
California
District of Columbia
Idaho
Kansas
Maryland
Mississippi
Nevada
New York
Oklahoma
South Carolina
Utah
West Virginia
Alaska
Colorado
Florida
Illinois
Kentucky
Massachusetts
Missouri
New Hampshire
North Carolina
Oregon
South Dakota
Vermont
Wisconsin
References
The racial-ethnic minority student count is calculated by taking the total number of students and subtracting white students, international students, and students whose race/ethnicity was unknown. This number is then divided by the total number of students to obtain the percentage of racial-ethnic minorities.
- College Factual
- National Center for Education Statistics (IPEDS)
- O*NET Online
- U.S. Bureau of Labor Statistics
- U.S. Department of Education College Scorecard
More about our data sources and methodologies.
Course Advisor provides higher-education, college and university, degree, program, career, salary, and other helpful information to students, faculty, institutions, and other internet audiences. Presented information and data are subject to change. Inclusion on this website does not imply or represent a direct relationship with the company, school, or brand. Information, though believed correct at time of publication, may not be correct, and no warranty is provided. Contact the schools to verify any information before relying on it. Financial aid may be available for those who qualify. The displayed options may include sponsored or recommended results, not necessarily based on your preferences.
© Course Advisor – All Rights Reserved.