Boston College Science & Tech Programs
Boston College is a private not-for-profit institution located in Chestnut Hill, MA. A Smaller City offers a peaceful environment with access to urban amenities.
Featured schools near , edit
Boston College Rankings
Boston College is featured in these rankings for science & tech programs at the bachelors level:
| Ranking | Rank | Among |
|---|---|---|
| Overall Quality | #1 of 120 | State — Massachusetts |
| Overall Quality | #1 of 254 | Region — New England |
| Overall Quality | #13 of 4,630 | Nationwide |
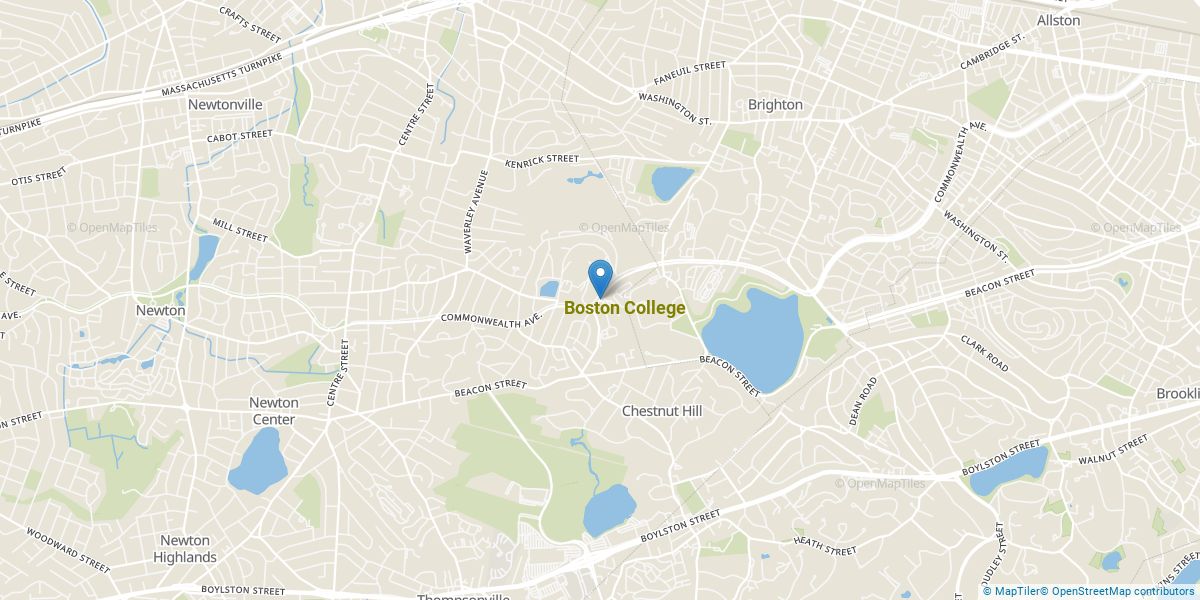
Where Is Boston College?
Get in touch with Boston College are given below.
| Contact Details | |
|---|---|
| Address: | 140 Commonwealth Avenue, Chestnut Hill, MA 02467 |
| Phone: | 6175528000 |
| Website: | www.bc.edu/ |
| Admissions: | www.bc.edu/content/bc-web/admission.html |
| Financial Aid: | www.bc.edu/bc-web/offices/student-services/financial-aid.html |
How Do I Get Into Boston College?
You can apply to Boston College online at: www.commonapp.org/
Boston College is classified as Highly Selective (10-20%) for admissions.
Admission Requirements for Boston College
These are the things Boston College considers when reviewing applications:
| Requirement | Status |
|---|---|
| Secondary School Record | Required |
| Secondary School GPA | Considered but not required |
| Recommendations | Required |
| Admission Test Scores (SAT/ACT) | Considered but not required |
How Hard Is It To Get Into Boston College?
Boston College admits 16%, making it very selective and competitive. Be sure to prepare a complete application and prepare the application in full.
Of those admitted, 44% choose to enroll — a strong indicator that admitted students commit to enrolling.
Average Test Scores
30% of admitted students submitted SAT scores and 15% submitted ACT scores.
When looking at the 25th through the 75th percentile of admitted students at Boston College, SAT Evidence-Based Reading and Writing scores ranged between 710 and 760. Math scores were between 730 and 780.
Selectivity by Gender
Selectivity numbers at Boston College can differ by gender.
| Gender | Applicants | Admitted | Acceptance Rate |
|---|---|---|---|
| Men | 14,202 | 2,853 | 20% |
| Women | 20,829 | 2,902 | 14% |
Can I Afford Boston College?
The average net price after aid at Boston College is $39,866. The affordability of the school largely depends on your financial need since net price varies by income group.
Tuition & Fees
| Category | Cost |
|---|---|
| In-State Tuition | $69,400 |
| In-State Fees | $1,302 |
| Out-of-State Tuition | $69,400 |
| Out-of-State Fees | $1,302 |
| Total In-State Tuition & Fees | $70,702 |
| Total Out-of-State Tuition & Fees | $70,702 |
Financial Aid
When including loans, work-study, and grants, 23% of students at Boston College receive some form of financial aid (2,335 students).
About 45% of students at Boston College receive grant or scholarship aid, averaging $50,287 per student.
13% of students receive federal Pell Grants, averaging $6,006.
Student Loan Debt
30% of Boston College undergraduates take out federal student loans, averaging $4,801 per year.
Boston College Undergraduate Student Diversity
There are 6,179 students enrolled at Boston College. Boston College is classified as a 10,000 - 19,999 institution by enrollment size. Its Carnegie Classification is Doctoral Universities: Highest Research Activity.
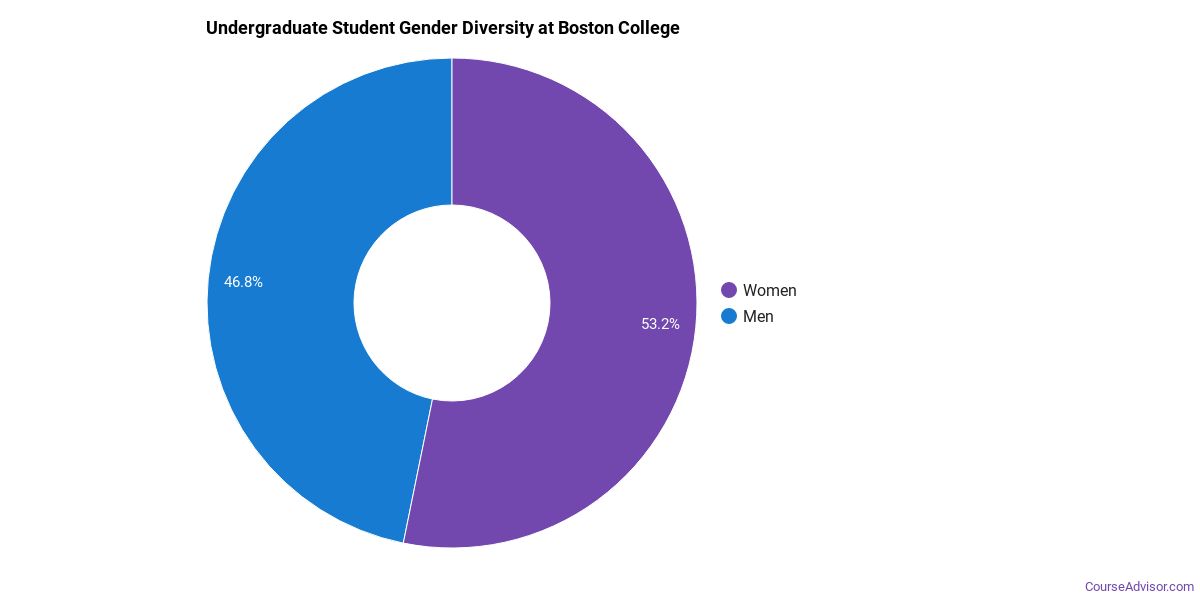
Gender Diversity
Of the 9,865 undergraduate students at Boston College, approximately 48% are male and 52% are female.
Racial-Ethnic Diversity
The racial-ethnic breakdown of Boston College undergraduate students is as follows.
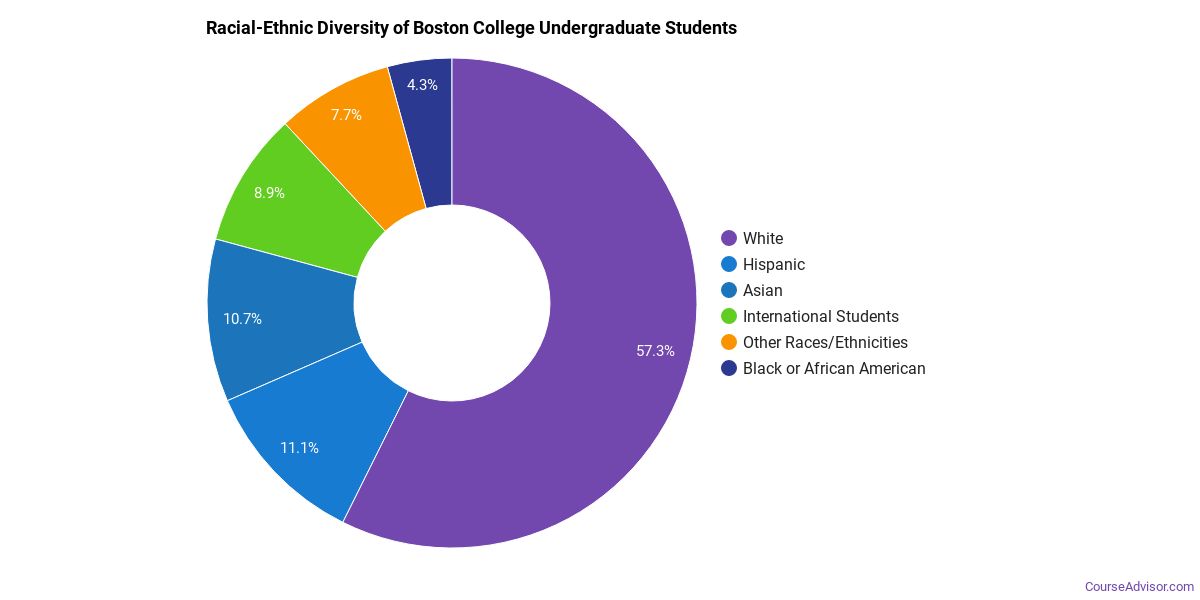
| Race/Ethnicity | Number of Students |
|---|---|
| Asian | 1,085 |
| Black or African American | 512 |
| Hispanic | 1,252 |
| White | 5,514 |
| Native Hawaiian/Pacific Islander | 9 |
| Two or More Races | 493 |
| Non-Resident | 631 |
Geographic Diversity
The top 5 home states of first-time undergraduate students at Boston College break down as follows.

| State | First-Time UG Students |
|---|---|
| Massachusetts | 576 |
| New York | 332 |
| New Jersey | 228 |
| Connecticut | 143 |
| California | 142 |
Additionally, approximately 6.4% of undergraduate students are non-resident from outside the United States.
Boston College Graduate Student Diversity
5,197 of Boston College’s students are in graduate programs. The highest graduate-level award offered is Doctor’s degree.
Gender Diversity (Graduate)
Among graduate students at Boston College, approximately 42% are male and 58% are female.

Racial-Ethnic Diversity (Graduate)
The racial-ethnic breakdown of Boston College graduate students is as follows.

| Race/Ethnicity | Number of Students |
|---|---|
| Asian | 327 |
| Black or African American | 301 |
| Hispanic | 379 |
| White | 2,821 |
| American Indian/Alaska Native | 5 |
| Two or More Races | 150 |
| Non-Resident | 982 |
Online Learning at Boston College
Boston College provides distance learning options for students who need flexibility.
876 undergraduate students at Boston College took at least one online class — of those, 133 took all of their classes online.
At the graduate level, 1,163 students took at least one online class and 599 took all classes online. Distance education is available at the undergraduate and graduate levels.
Academic Programs at Boston College
Boston College offers 25 distinct academic programs.
The highest level of award offered is Doctor’s degree.
Institutional Profile
Boston College maintains an open admission policy: No. Credit transfer:
- AP credits: Yes
- Dual enrollment credits: Yes
- Life experience credits: Implied no
References
More about our data sources and methodologies.
Course Advisor provides higher-education, college and university, degree, program, career, salary, and other helpful information to students, faculty, institutions, and other internet audiences. Presented information and data are subject to change. Inclusion on this website does not imply or represent a direct relationship with the company, school, or brand. Information, though believed correct at time of publication, may not be correct, and no warranty is provided. Contact the schools to verify any information before relying on it. Financial aid may be available for those who qualify. The displayed options may include sponsored or recommended results, not necessarily based on your preferences.
© Course Advisor – All Rights Reserved.