Liberal Arts General Studies Undergraduate Certificates
A undergraduate certificate in Liberal Arts General Studies is offered at 2,050 colleges in the United States, where you can earn aundergraduate certificate in Liberal Arts General Studies. In recent years, the majority of students earning degrees in this area were women, and about54% were students from underrepresented racial-ethnic groups. Also, 1.7% of Liberal Arts General Studies graduates were international students.
Featured schools near , edit
Education Levels of Liberal Arts General Studies Majors
In the most recent reporting year, 540,324 students earned theirLiberal Arts General Studies majors across all award levels. The following table shows the number of diplomas awarded in Liberal Arts General Studies at each degree level.
| Education Level | Number of Grads |
|---|---|
| Certificate (this page) | 114,608 |
| Associate’s Degree | 363,119 |
| Bachelor’s Degree | 38,260 |
| Master’s Degree | 24,160 |
| Doctor’s Degree | 141 |

Earnings of Liberal Arts General Studies Majors With Undergraduate Certificates (All Award Levels)
Federal data tracks the median salary for graduates with aundergraduate certificate in Liberal Arts General Studies of $37,934 four years after graduation. These figures are reported program-wide, across all award levels.
A lot of factors can contribute to this number, such as the location of your workplace and the availability of other perks and bonuses.
| Years After Graduation | Median Earnings |
|---|---|
| 1 year | $32,164 |
| 4 years | $37,934 |
| 5 years | $44,008 |
Source: U.S. Department of Education College Scorecard, field-of-study earnings tracker (program-wide, all award levels).
Student Debt (All Award Levels)
The data on debt ranges for Liberal Arts General Studies majors who have their undergraduate certificate is not currently available.
Student Diversity
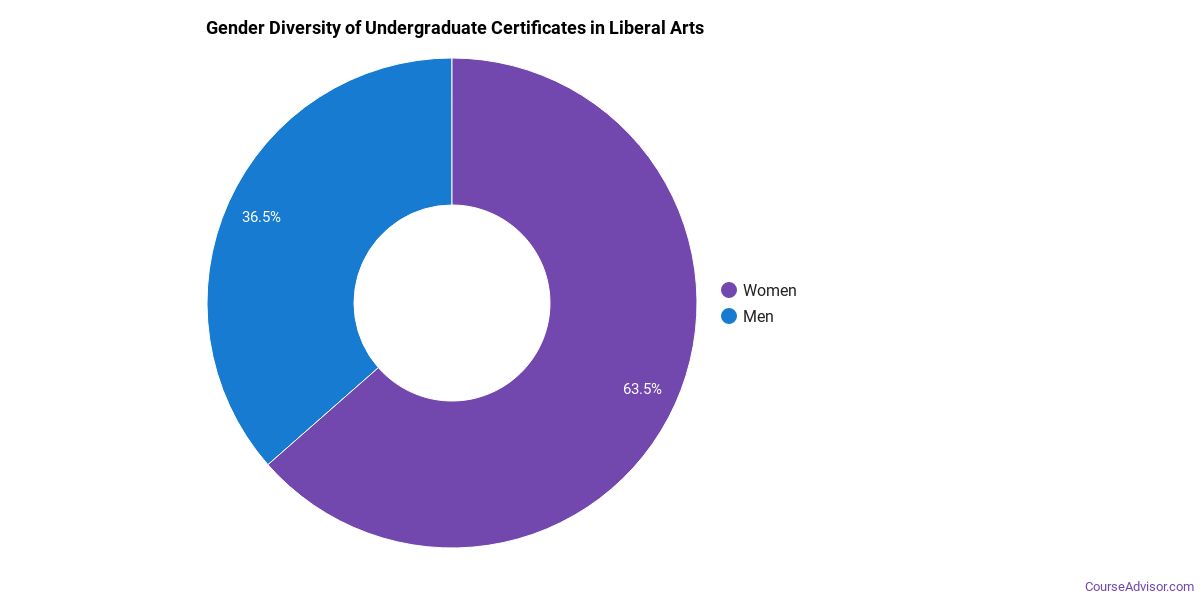
More women than men pursue their undergraduate certificate in Liberal Arts General Studies. About 60.1% of graduates with this degree are women.
| Gender | Number of Grads |
|---|---|
| Men | 45,691 |
| Women | 68,917 |
The racial-ethnic distribution of Liberal Arts General Studies graduates is as follows:
| Race / Ethnicity | Number of Grads | Share |
|---|---|---|
| White | 50,261 | 43.9% |
| Asian | 8,917 | 7.8% |
| Hispanic or Latino | 36,363 | 31.7% |
| Black or African American | 7,415 | 6.5% |
| American Indian / Alaska Native | 612 | 0.5% |
| Native Hawaiian / Pacific Islander | 261 | 0.2% |
| Two or More Races | 4,901 | 4.3% |
| Race Unknown | 3,878 | 3.4% |
| International Students | 2,000 | 1.7% |
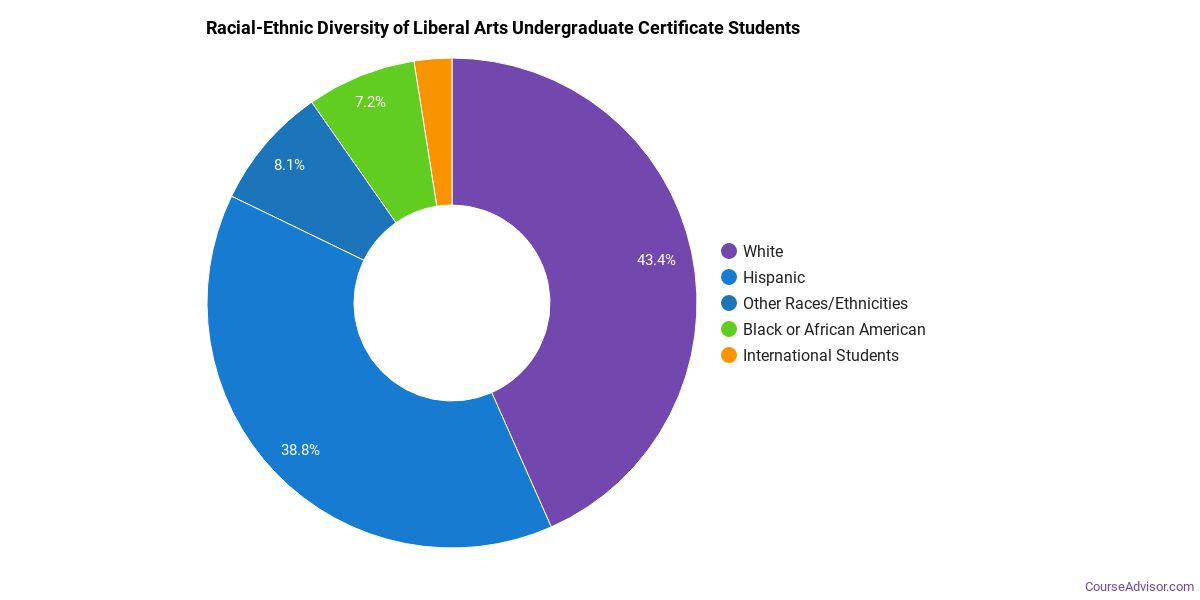
This degree is not very popular with international students. Only 1.7% of graduates fall into this category.
See the minority definition in the References below.
Most Popular Liberal Arts General Studies Programs for Undergraduate Certificates
There are 2,221 colleges that offer a undergraduate certificate in Liberal Arts General Studies. Learn more about the most popular below:

Santa Monica College tops the list of the most popular schools in the U.S. for Liberal Arts General Studies majors seeking their undergraduate certificate. During the most recent year for which we have data, 9,669 people received their undergraduate certificate in Liberal Arts General Studies from this school. Data shows that graduates who hold this degree go on to make a median salary of $40,669.
Ivy Tech Community College comes in at #2 on our list of the most popular colleges offering undergraduate certificates in Liberal Arts General Studies. This school awarded 7,726 undergraduate certificates in Liberal Arts General Studies in the most recent reporting year. Graduates who complete their undergraduate certificate in Liberal Arts General Studies here go on to a median salary of $40,669.
Lone Star College System comes in at #3 on our list of the most popular colleges offering undergraduate certificates in Liberal Arts General Studies. This school awarded 6,485 undergraduate certificates in Liberal Arts General Studies in the most recent reporting year. Graduates who complete their undergraduate certificate in Liberal Arts General Studies here go on to a median salary of $40,669.
Miami Dade College comes in at #4 on our list of the most popular colleges offering undergraduate certificates in Liberal Arts General Studies. This school awarded 6,449 undergraduate certificates in Liberal Arts General Studies in the most recent reporting year. Graduates who complete their undergraduate certificate in Liberal Arts General Studies here go on to a median salary of $40,669.
Valencia College comes in at #5 on our list of the most popular colleges offering undergraduate certificates in Liberal Arts General Studies. This school awarded 6,079 undergraduate certificates in Liberal Arts General Studies in the most recent reporting year. Graduates who complete their undergraduate certificate in Liberal Arts General Studies here go on to a median salary of $40,669.
Indiana University-Bloomington is a popular choice for Liberal Arts General Studies majors seeking their undergraduate certificate. During the most recent year for which we have data, 6,020 people received their undergraduate certificate in Liberal Arts General Studies from this school. Graduates who complete their undergraduate certificate in Liberal Arts General Studies here go on to a median salary of $40,669.
Utah State University is a popular choice for Liberal Arts General Studies majors seeking their undergraduate certificate. This school awarded 5,437 undergraduate certificates in Liberal Arts General Studies in the most recent reporting year. Graduates who complete their undergraduate certificate in Liberal Arts General Studies here go on to a median salary of $40,669.
Dallas College comes in at #8 on our list of the most popular colleges offering undergraduate certificates in Liberal Arts General Studies. This school awarded 5,426 undergraduate certificates in Liberal Arts General Studies in the most recent reporting year. Data shows that graduates who hold this degree go on to make a median salary of $40,669.
Saddleback College comes in at #9 on our list of the most popular colleges offering undergraduate certificates in Liberal Arts General Studies. This school awarded 5,098 undergraduate certificates in Liberal Arts General Studies in the most recent reporting year. Graduates who complete their undergraduate certificate in Liberal Arts General Studies here go on to a median salary of $40,669.
Utah Valley University comes in at #10 on our list of the most popular colleges offering undergraduate certificates in Liberal Arts General Studies. During the most recent year for which we have data, 4,583 people received their undergraduate certificate in Liberal Arts General Studies from this school. Data shows that graduates who hold this degree go on to make a median salary of $40,669.
Tarrant County College District comes in at #11 on our list of the most popular colleges offering undergraduate certificates in Liberal Arts General Studies. During the most recent year for which we have data, 4,283 people received their undergraduate certificate in Liberal Arts General Studies from this school. Graduates who complete their undergraduate certificate in Liberal Arts General Studies here go on to a median salary of $40,669.
Bakersfield College is a popular choice for Liberal Arts General Studies majors seeking their undergraduate certificate. During the most recent year for which we have data, 4,030 people received their undergraduate certificate in Liberal Arts General Studies from this school. Data shows that graduates who hold this degree go on to make a median salary of $40,669.
Broward College comes in at #13 on our list of the most popular colleges offering undergraduate certificates in Liberal Arts General Studies. During the most recent year for which we have data, 3,513 people received their undergraduate certificate in Liberal Arts General Studies from this school. Graduates who complete their undergraduate certificate in Liberal Arts General Studies here go on to a median salary of $40,669.
Los Angeles Pierce College comes in at #14 on our list of the most popular colleges offering undergraduate certificates in Liberal Arts General Studies. This school awarded 3,366 undergraduate certificates in Liberal Arts General Studies in the most recent reporting year. Graduates who complete their undergraduate certificate in Liberal Arts General Studies here go on to a median salary of $40,669.
Golden West College comes in at #15 on our list of the most popular colleges offering undergraduate certificates in Liberal Arts General Studies. This school awarded 3,358 undergraduate certificates in Liberal Arts General Studies in the most recent reporting year. Data shows that graduates who hold this degree go on to make a median salary of $40,669.
Moorpark College comes in at #16 on our list of the most popular colleges offering undergraduate certificates in Liberal Arts General Studies. During the most recent year for which we have data, 2,885 people received their undergraduate certificate in Liberal Arts General Studies from this school. Data shows that graduates who hold this degree go on to make a median salary of $40,669.
Pima Community College is a popular choice for Liberal Arts General Studies majors seeking their undergraduate certificate. This school awarded 2,813 undergraduate certificates in Liberal Arts General Studies in the most recent reporting year. Data shows that graduates who hold this degree go on to make a median salary of $40,669.
Palm Beach State College is a popular choice for Liberal Arts General Studies majors seeking their undergraduate certificate. This school awarded 2,802 undergraduate certificates in Liberal Arts General Studies in the most recent reporting year. Data shows that graduates who hold this degree go on to make a median salary of $40,669.
Collin County Community College District is a popular choice for Liberal Arts General Studies majors seeking their undergraduate certificate. This school awarded 2,782 undergraduate certificates in Liberal Arts General Studies in the most recent reporting year. Data shows that graduates who hold this degree go on to make a median salary of $40,669.
Southern New Hampshire University is a popular choice for Liberal Arts General Studies majors seeking their undergraduate certificate. This school awarded 2,735 undergraduate certificates in Liberal Arts General Studies in the most recent reporting year. Data shows that graduates who hold this degree go on to make a median salary of $40,669.
Liberal Arts General Studies Majors to Study
| Major | Annual Degrees Awarded |
|---|---|
| Liberal Arts and Sciences/Liberal Studies | 344,220 |
| General Studies | 127,908 |
| Liberal Arts and Sciences, General Studies and Humanities, Other | 45,889 |
| Humanities/Humanistic Studies | 22,307 |
Explore Liberal Arts General Studies by State
Alabama
California
District of Columbia
Idaho
Kansas
Maryland
Mississippi
Nevada
New York
Oklahoma
South Carolina
Utah
West Virginia
Alaska
Colorado
Florida
Illinois
Kentucky
Massachusetts
Missouri
New Hampshire
North Carolina
Oregon
South Dakota
Vermont
Wisconsin
Related Majors
Below are some popular majors similar to Liberal Arts General Studies that also offer undergraduate certificates.
| Major | Annual Degrees Awarded |
|---|---|
| LIBERAL ARTS AND SCIENCES, GENERAL STUDIES AND HUMANITIES | — |
References
The racial-ethnic minority student count is calculated by taking the total number of students and subtracting white students, international students, and students whose race/ethnicity was unknown. This number is then divided by the total number of students to obtain the percentage of racial-ethnic minorities.
- College Factual
- National Center for Education Statistics (IPEDS)
- O*NET Online
- U.S. Bureau of Labor Statistics
- U.S. Department of Education College Scorecard
More about our data sources and methodologies.
Course Advisor provides higher-education, college and university, degree, program, career, salary, and other helpful information to students, faculty, institutions, and other internet audiences. Presented information and data are subject to change. Inclusion on this website does not imply or represent a direct relationship with the company, school, or brand. Information, though believed correct at time of publication, may not be correct, and no warranty is provided. Contact the schools to verify any information before relying on it. Financial aid may be available for those who qualify. The displayed options may include sponsored or recommended results, not necessarily based on your preferences.
© Course Advisor – All Rights Reserved.