Valencia College Overview
Valencia College is a public institution situated in Orlando, Florida. Orlando is a great location for students who prefer city over country life.
What Is Valencia College Known For?
- The 3% student loan default rate at Valencia College is better than the national rate of 10.1%. That's a good sign that you may be able to pay off student loans easier than your peers at other schools can.
- Although it may not be available for every major, the bachelor's degree is the highest award a student can attain at Valencia College.
- In <nil>, 41% of the faculty were full-time.
Featured schools near , edit
Where Is Valencia College?

Contact details for Valencia College are given below.
| Contact Details | |
|---|---|
| Address: | 1768 Park Center Drive, Orlando, FL 32835 |
| Phone: | 407-299-2187 |
| Website: | valenciacollege.edu |
How Do I Get Into Valencia College?
You can apply to Valencia College online at: https://valenciacollege.edu/admissions/apply.php
Can I Afford Valencia College?
Student Loan Debt
It's not uncommon for college students to take out loans to pay for school. In fact, almost 66% of students nationwide depend at least partially on loans. At Valencia College, approximately 22% of students took out student loans averaging $5,148 a year. That adds up to $20,592 over four years for those students.
The student loan default rate at Valencia College is 2.5%. This is significantly lower than the national default rate of 10.1%, which is a good sign that you'll be able to pay back your student loans.
Valencia College Undergraduate Student Diversity

Gender Diversity
Of the 14,581 full-time undergraduates at Valencia College, 43% are male and 57% are female.

Racial-Ethnic Diversity
The racial-ethnic breakdown of Valencia College students is as follows.

| Race/Ethnicity | Number of Grads |
|---|---|
| Asian | 762 |
| Black or African American | 2,111 |
| Hispanic or Latino | 5,771 |
| White | 3,830 |
| International Students | 1,133 |
| Other Races/Ethnicities | 974 |
Geographic Diversity
Florida students aren't the only ones who study at Valencia College. At this time, 18 states are represented by the student population at the school.
Over 119 countries are represented at Valencia College. The most popular countries sending students to the school are Brazil, Venezuela, and China.
Online Learning at Valencia College
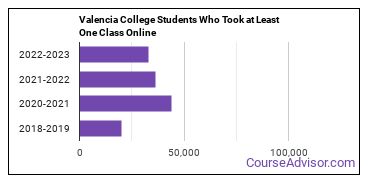
The following chart shows how the online learning population at Valencia College has changed over the last few years.

Online Growth Rankings of Valencia College
The average growth rate over the last four years of online students at Valencia College was 95.4%. This is the #437 largest growth rate of all schools that are mostly online. This refers to all students at Valencia College regardless of major.
When we speak of partially online, we are referring to schools whose online population is less than 50% of its total student body. Mostly online refers to those with online populations greater than or equal to 50%.
References
*The racial-ethnic minorities count is calculated by taking the total number of students and subtracting white students, international students, and students whose race/ethnicity was unknown. This number is then divided by the total number of students at the school to obtain the racial-ethnic minorities percentage.
More about our data sources and methodologies.
Featured Schools
 Request Info
|
Southern New Hampshire University You have goals. Southern New Hampshire University can help you get there. Whether you need a bachelor's degree to get into a career or want a master's degree to move up in your current career, SNHU has an online program for you. Find your degree from over 200 online programs. Learn More > |
