Food Science Technology Undergraduate Certificates
There are 127 colleges and universities across the nation that offer aundergraduate certificate in Food Science Technology. Among those who recently graduated from the schools offering this degree, the majority were men, and29% were students from underrepresented racial-ethnic groups.
Featured schools near , edit
Education Levels of Food Science Technology Majors
In the most recent reporting year, 2,269 students earned theirFood Science Technology majors across all award levels. The following table shows the number of diplomas awarded in Food Science Technology at each degree level.
| Education Level | Number of Grads |
|---|---|
| Certificate (this page) | 72 |
| Associate’s Degree | 112 |
| Bachelor’s Degree | 1,124 |
| Master’s Degree | 779 |
| Doctor’s Degree | 177 |
Earnings of Food Science Technology Majors With Undergraduate Certificates (All Award Levels)
The median salary for graduates holding aundergraduate certificate in Food Science Technology of $59,662 four years after graduation. These figures are reported program-wide, across all award levels.
This number may vary for many reasons. For instance, you may move to a location where people with your degree are rare and make more money.
| Years After Graduation | Median Earnings |
|---|---|
| 1 year | $55,828 |
| 4 years | $59,662 |
| 5 years | $68,842 |
Source: U.S. Department of Education College Scorecard, field-of-study earnings tracker (program-wide, all award levels).
Student Debt (All Award Levels)
We do not have the data to calculate the median and range of debt loads for Food Science Technology students with their undergraduate certificate.
Student Diversity
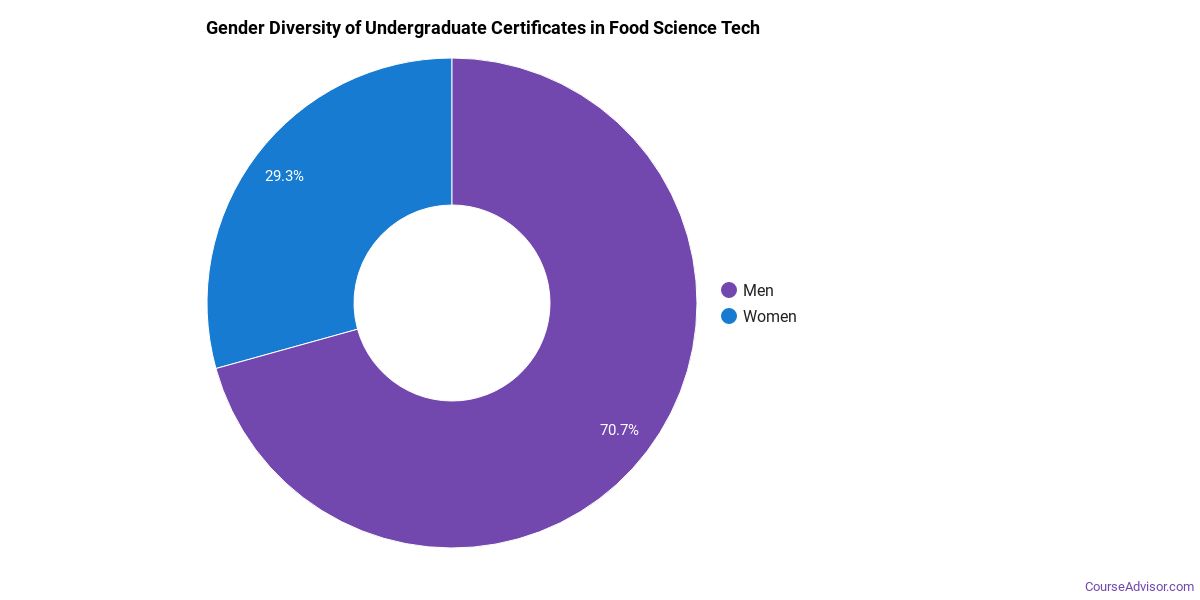
This degree is more popular with male students. About 75.0% of graduates in this field are men.
| Gender | Number of Grads |
|---|---|
| Men | 54 |
| Women | 18 |
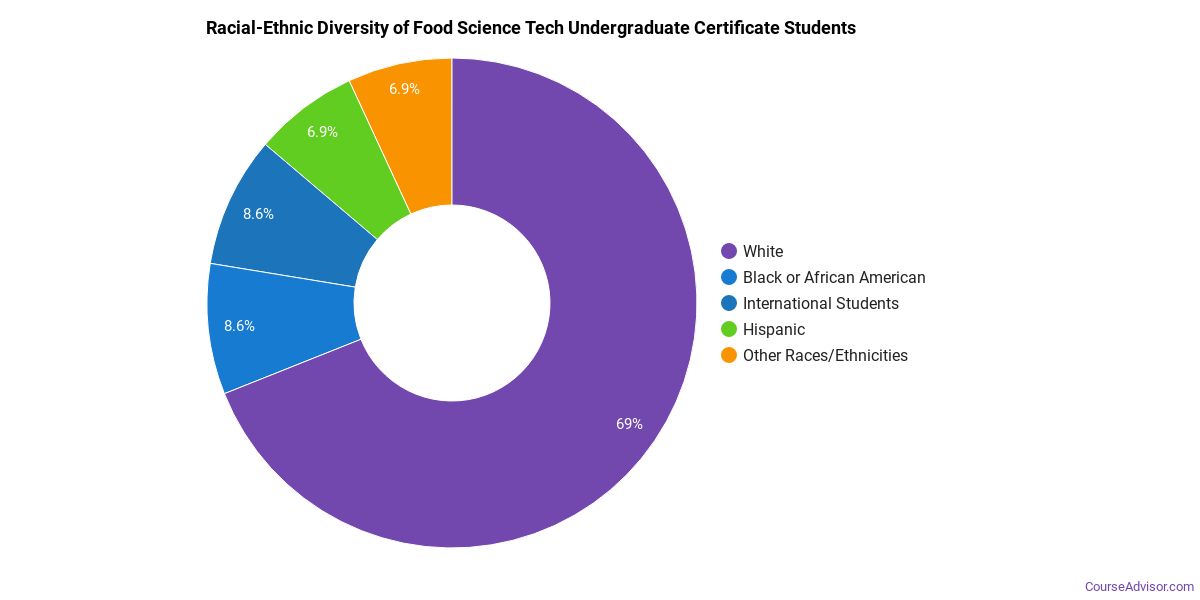
The racial-ethnic distribution of Food Science Technology graduates is as follows:
| Race / Ethnicity | Number of Grads | Share |
|---|---|---|
| White | 51 | 70.8% |
| Asian | 1 | 1.4% |
| Hispanic or Latino | 14 | 19.4% |
| Black or African American | 1 | 1.4% |
| American Indian / Alaska Native | 1 | 1.4% |
| Two or More Races | 2 | 2.8% |
| Race Unknown | 2 | 2.8% |
See the minority definition in the References below.
Most Popular Food Science Technology Programs for Undergraduate Certificates
There are 161 colleges that offer a undergraduate certificate in Food Science Technology. Learn more about the most popular below:

The most popular school in the United States for Food Science Technology students seeking a undergraduate certificate is University of Illinois Urbana-Champaign. During the most recent year for which we have data, 129 people received their undergraduate certificate in Food Science Technology from this school. Data shows that graduates who hold this degree go on to make a median salary of $40,669.
California Polytechnic State University-San Luis Obispo is a popular choice for Food Science Technology majors seeking their undergraduate certificate. During the most recent year for which we have data, 109 people received their undergraduate certificate in Food Science Technology from this school. Data shows that graduates who hold this degree go on to make a median salary of $40,669.
Clemson University comes in at #3 on our list of the most popular colleges offering undergraduate certificates in Food Science Technology. This school awarded 109 undergraduate certificates in Food Science Technology in the most recent reporting year. Graduates who complete their undergraduate certificate in Food Science Technology here go on to a median salary of $40,669.
Kansas State University is a popular choice for Food Science Technology majors seeking their undergraduate certificate. During the most recent year for which we have data, 89 people received their undergraduate certificate in Food Science Technology from this school. Data shows that graduates who hold this degree go on to make a median salary of $40,669.
University of California-Davis is a popular choice for Food Science Technology majors seeking their undergraduate certificate. This school awarded 83 undergraduate certificates in Food Science Technology in the most recent reporting year. Graduates who complete their undergraduate certificate in Food Science Technology here go on to a median salary of $40,669.
Cornell University is a popular choice for Food Science Technology majors seeking their undergraduate certificate. During the most recent year for which we have data, 74 people received their undergraduate certificate in Food Science Technology from this school. Data shows that graduates who hold this degree go on to make a median salary of $40,669.
University of Kentucky is a popular choice for Food Science Technology majors seeking their undergraduate certificate. This school awarded 66 undergraduate certificates in Food Science Technology in the most recent reporting year. Data shows that graduates who hold this degree go on to make a median salary of $40,669.
University of Nebraska-Lincoln is a popular choice for Food Science Technology majors seeking their undergraduate certificate. This school awarded 65 undergraduate certificates in Food Science Technology in the most recent reporting year. Graduates who complete their undergraduate certificate in Food Science Technology here go on to a median salary of $40,669.
Michigan State University comes in at #9 on our list of the most popular colleges offering undergraduate certificates in Food Science Technology. During the most recent year for which we have data, 58 people received their undergraduate certificate in Food Science Technology from this school. Graduates who complete their undergraduate certificate in Food Science Technology here go on to a median salary of $40,669.
Ohio State University-Main Campus is a popular choice for Food Science Technology majors seeking their undergraduate certificate. This school awarded 48 undergraduate certificates in Food Science Technology in the most recent reporting year. Data shows that graduates who hold this degree go on to make a median salary of $40,669.
University of Florida comes in at #11 on our list of the most popular colleges offering undergraduate certificates in Food Science Technology. During the most recent year for which we have data, 48 people received their undergraduate certificate in Food Science Technology from this school. Data shows that graduates who hold this degree go on to make a median salary of $40,669.
California State University-Fresno is a popular choice for Food Science Technology majors seeking their undergraduate certificate. During the most recent year for which we have data, 46 people received their undergraduate certificate in Food Science Technology from this school. Data shows that graduates who hold this degree go on to make a median salary of $40,669.
Pennsylvania State University-Main Campus is a popular choice for Food Science Technology majors seeking their undergraduate certificate. This school awarded 44 undergraduate certificates in Food Science Technology in the most recent reporting year. Graduates who complete their undergraduate certificate in Food Science Technology here go on to a median salary of $40,669.
University of Wisconsin-Stout is a popular choice for Food Science Technology majors seeking their undergraduate certificate. This school awarded 43 undergraduate certificates in Food Science Technology in the most recent reporting year. Data shows that graduates who hold this degree go on to make a median salary of $40,669.
University of Massachusetts-Amherst comes in at #15 on our list of the most popular colleges offering undergraduate certificates in Food Science Technology. This school awarded 41 undergraduate certificates in Food Science Technology in the most recent reporting year. Data shows that graduates who hold this degree go on to make a median salary of $40,669.
University of Wisconsin-Madison is a popular choice for Food Science Technology majors seeking their undergraduate certificate. During the most recent year for which we have data, 40 people received their undergraduate certificate in Food Science Technology from this school. Data shows that graduates who hold this degree go on to make a median salary of $40,669.
University of Arkansas is a popular choice for Food Science Technology majors seeking their undergraduate certificate. This school awarded 39 undergraduate certificates in Food Science Technology in the most recent reporting year. Data shows that graduates who hold this degree go on to make a median salary of $40,669.
Oregon State University comes in at #18 on our list of the most popular colleges offering undergraduate certificates in Food Science Technology. This school awarded 38 undergraduate certificates in Food Science Technology in the most recent reporting year. Graduates who complete their undergraduate certificate in Food Science Technology here go on to a median salary of $40,669.
Purdue University-Main Campus comes in at #19 on our list of the most popular colleges offering undergraduate certificates in Food Science Technology. This school awarded 36 undergraduate certificates in Food Science Technology in the most recent reporting year. Graduates who complete their undergraduate certificate in Food Science Technology here go on to a median salary of $40,669.
University of Maryland-College Park is a popular choice for Food Science Technology majors seeking their undergraduate certificate. During the most recent year for which we have data, 36 people received their undergraduate certificate in Food Science Technology from this school. Data shows that graduates who hold this degree go on to make a median salary of $40,669.
Food Science Technology Focus Areas
| Major | Annual Degrees Awarded |
|---|---|
| Food Science | 1,581 |
| Viticulture and Enology | 268 |
| Food Science and Technology, Other | 132 |
| Brewing Science | 118 |
| Food Technology and Processing | 96 |
Explore Food Science Technology by State
Alabama
California
District of Columbia
Idaho
Kansas
Maryland
Mississippi
Nevada
New York
Oklahoma
South Carolina
Utah
West Virginia
Alaska
Colorado
Florida
Illinois
Kentucky
Massachusetts
Missouri
New Hampshire
North Carolina
Oregon
South Dakota
Vermont
Wisconsin
Related Majors
Below are some popular majors similar to Food Science Technology that also offer undergraduate certificates.
| Major | Annual Degrees Awarded |
|---|---|
| Veterinary/Animal Health Technologies/Technicians | 9,051 |
| Agricultural Business and Management | 8,612 |
| Animal Sciences | 8,295 |
| Applied Horticulture and Horticultural Business Services | 4,164 |
| Veterinary Medicine | 3,756 |
References
The racial-ethnic minority student count is calculated by taking the total number of students and subtracting white students, international students, and students whose race/ethnicity was unknown. This number is then divided by the total number of students to obtain the percentage of racial-ethnic minorities.
- College Factual
- National Center for Education Statistics (IPEDS)
- O*NET Online
- U.S. Bureau of Labor Statistics
- U.S. Department of Education College Scorecard
More about our data sources and methodologies.
Course Advisor provides higher-education, college and university, degree, program, career, salary, and other helpful information to students, faculty, institutions, and other internet audiences. Presented information and data are subject to change. Inclusion on this website does not imply or represent a direct relationship with the company, school, or brand. Information, though believed correct at time of publication, may not be correct, and no warranty is provided. Contact the schools to verify any information before relying on it. Financial aid may be available for those who qualify. The displayed options may include sponsored or recommended results, not necessarily based on your preferences.
© Course Advisor – All Rights Reserved.